DATABASE: Absorption line strengths
Data files and descriptions
The OSSY database is consist of 6 files in fits format :
(note that objects are sorted in the same order they appear in all fits files)
- OSSY_SDSS_parameters.fits [Download: 36MB]
[description]
: General information describing objects. - OSSY_absorption.fits [Download: 187MB]
[description]
: Stellar absorption line strengths. - OSSY_emission_flux_errors.fits [Download: 405MB]
[description]
: Intrinsic emission-line fluxes and errors. The values of Emission line strengths are derived from 'intrinsic' shape of spectra, which is affected by both galactic and internal reddening. - OSSY_emission_aon_ew_sky.fits [Download: 359MB]
[description]
: Gaussian Amplitude / Noise (AON) of the emission-lines, Equivalent Widths (EWs), and flags for the sky contamination. Skyline contamination (λ5577.0, λ6300.0, λ6363.0Å) is provided with '0' (telluric-free) or '1' (contaminated). - OSSY_emission_observed_flux.fits [Download: 396MB]
[description]
: Emission-line fluxes as observed. The reddening attenuation (i.e., internal reddening) factor is not applied. - OSSY_quality_assessment_continuum.fits [Download: 28MB]
[description]
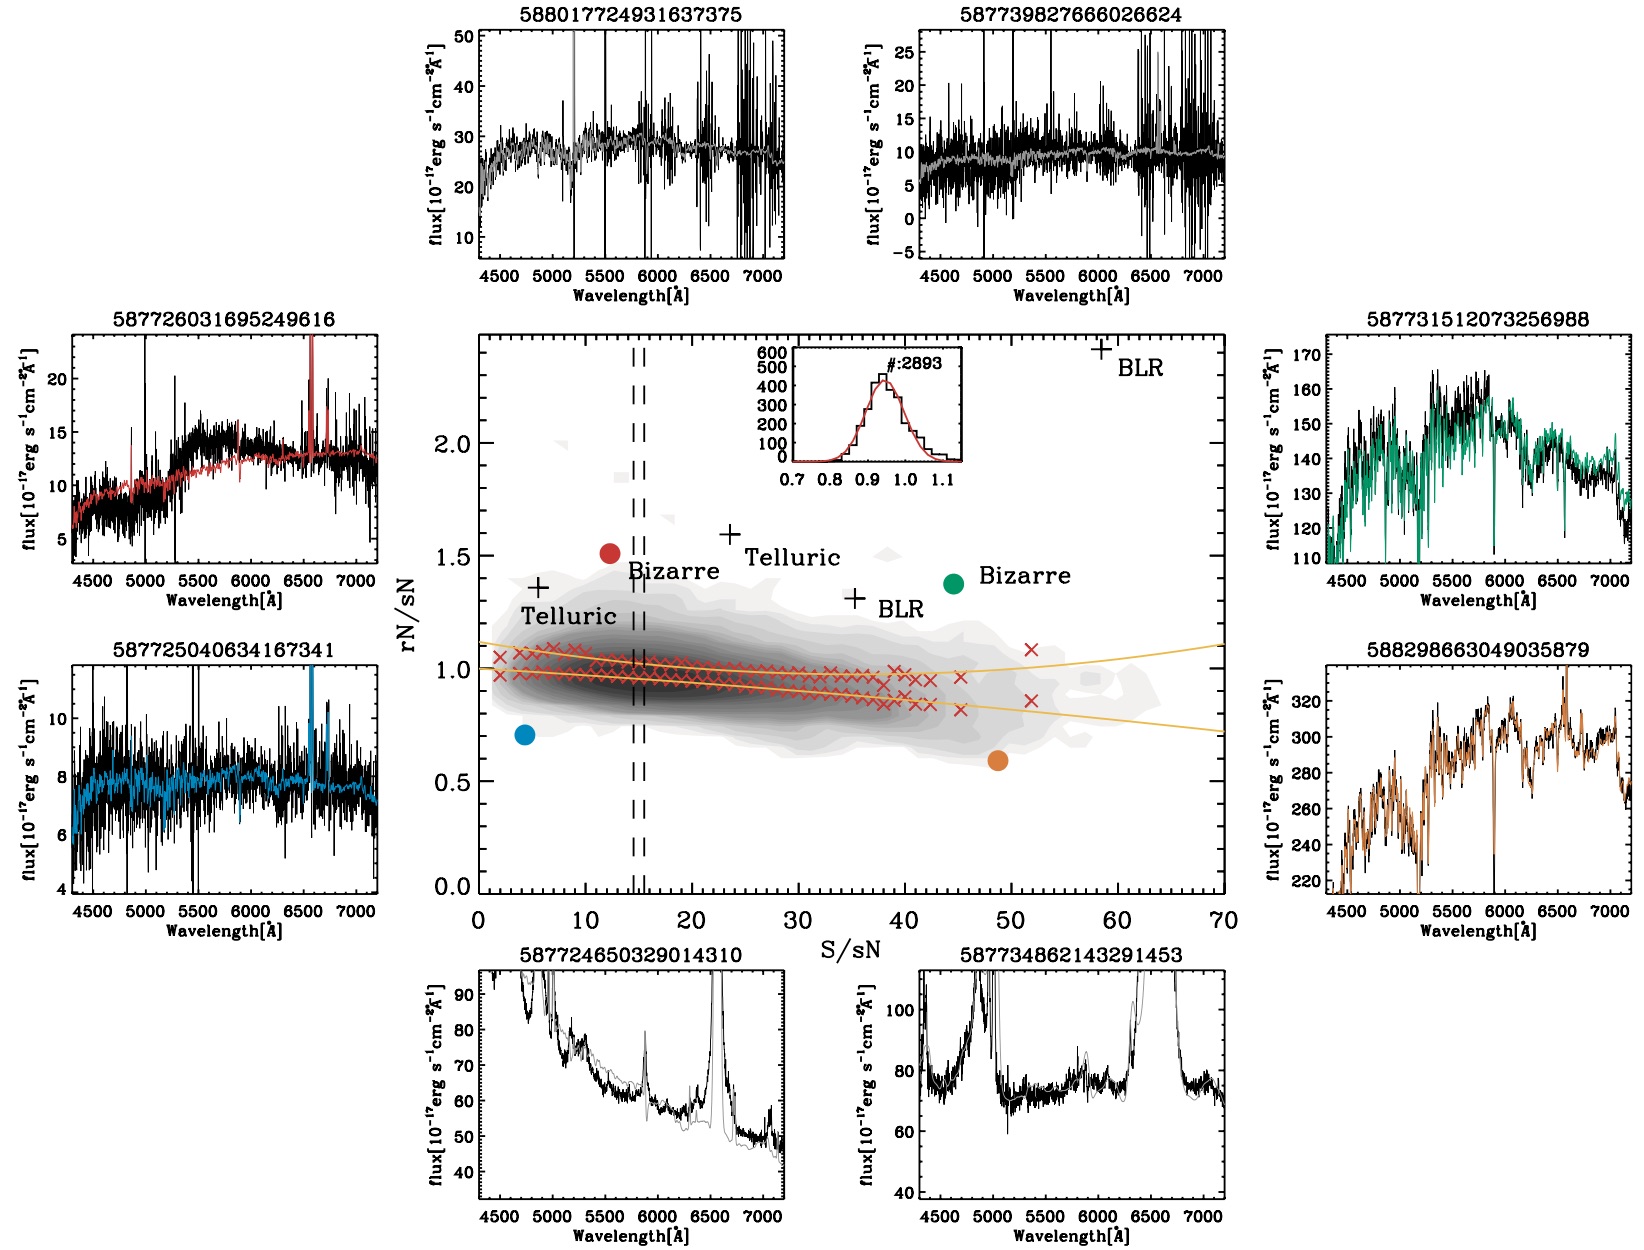
:Nσ is a measure of the continuum fitting quality, derived indicating the distance of the given object from the median line in the Figure shown below, in units of sigma. For example, Nσ=3 indicates that there are 99.73% probabiity that the object was a true outlier and only a 0.27% probability of being the result of random fluctuation.
| # | Name | Data Type/Units | Description |
| 0 | SDSS ID | string[1] | 18-digit |
| 1 | rN_SN | float[1] | Residual noise / statistical noise ratio |
| 2 | S_SN | float[1] | Signal / statistical noise |
| 3 | NSIGMA | float[1] | Deviation from the median distribution in units of sigma, Nσ. |