Comparisons with other database
OSSY vs. SDSS vs. MPA-JHU
There are two existing databases of SDSS DR7 data with which we can compare our own measurements. The first consists of the SDSS DR7 pipeline outputs, and the second comes from the MPA-JHU release of DR7 spectral measurements. As in previous releases, the SDSS DR7 pipeline does not remove the nebular emission prior to the absorption-line measurements, so we expected biases in cases of considerable ionised-gas emission. On the other hand, by following the method of Tremonti et al. (2004), the MPA-JHU measurements were based on a procedure that is similar to ours, whereby the nebular contribution to the spectra and the corresponding absorption-line infill was carefully treated. Yet, from the description of the MPA-JHU database, we determined some technical differences between their procedure and the method adopted here which proved important for interpreting possible discrepancies with our measurements. For instance, we measured the emission-line fluxes while simultaneously matching the stellar continuum and the nebular emission with GANDALF, whereas the MPA-JHU emission-line measurements were carried out on the residuals of a previous fit to the stellar continuum, presumably while masking the regions affected by emission, which we did when extracting the stellar kinematics with pPXF.
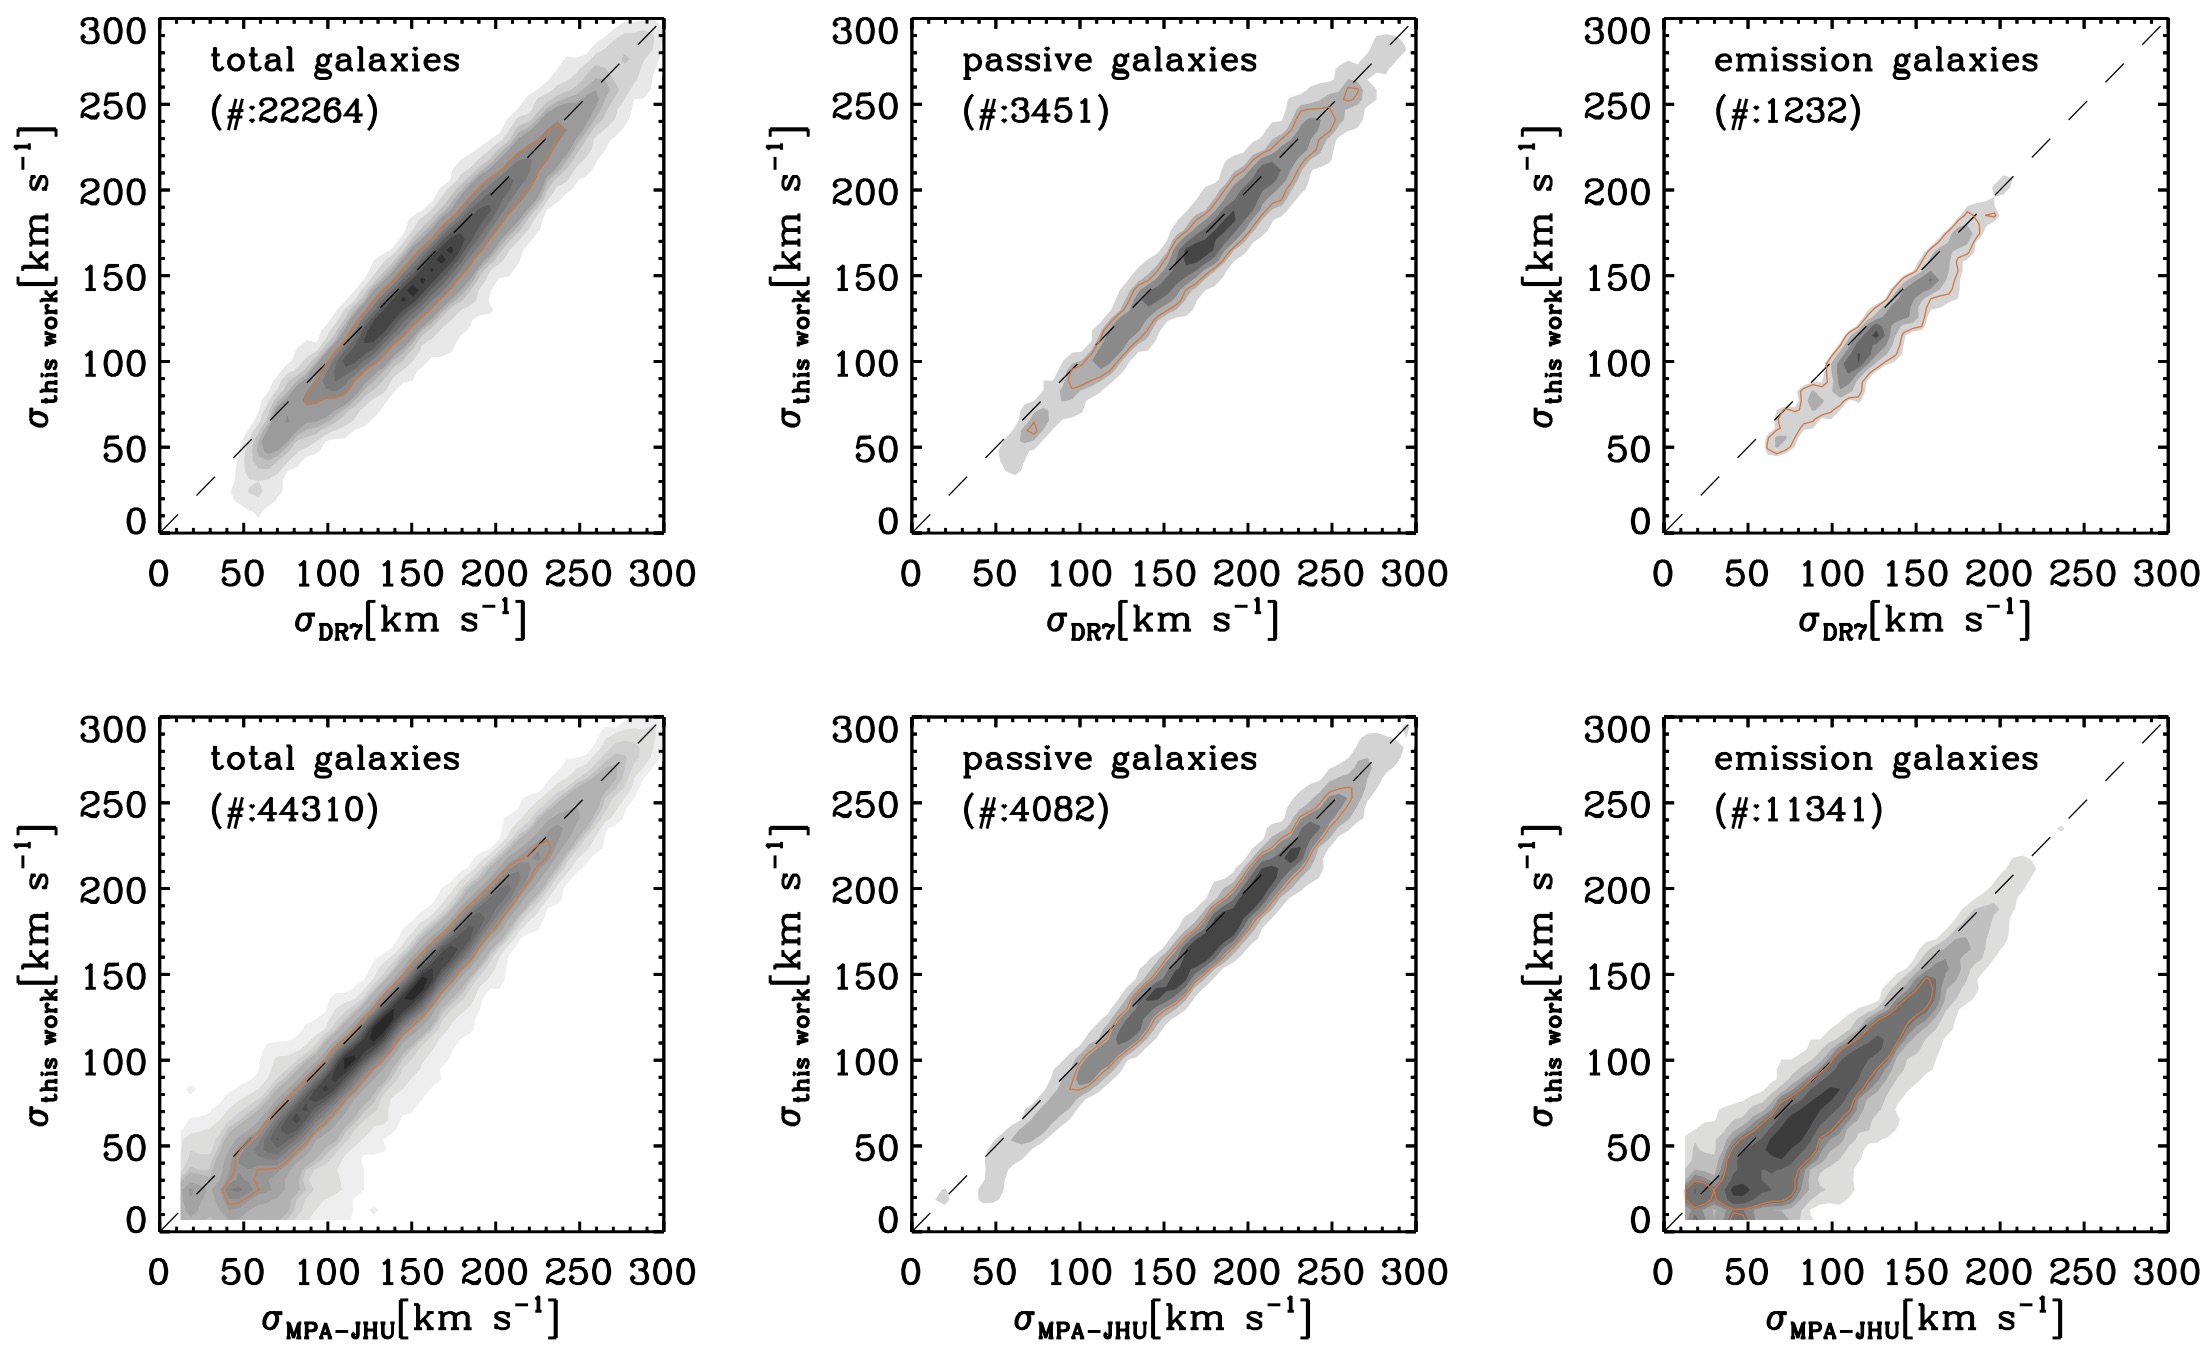
‣ Stellar KinematicsWe began by comparing, for the same subsample of randomly drawn ~46,000 objects used in the section of quality assessement, our pPXF velocity dispersion measurements with the corresponding values from both the SDSS DR7 and MPA-JHU databases. The overall agreement between the various measurements was good, although our velocity dispersion values appeared to follow more closely the SDSS DR7 data than the MPA-JHU. This occurred, in particular, at the low velocity dispersion regime, which is inhabited mostly by relatively faint spiral galaxies showing considerable amounts of nebular emission. In fact, at the very low velocity dispersion end of our sample the presence of emission caused most of the SDSS DR7 measurements to fail, and whereas the MPA-JHU catalogue reports velocity dispersion values for these objects, in most cases their values exceed ours. The large scatter in this regime can be explained by considering the low S/sN ratio of the spectra for such faint spirals, but such a bias cannot be easily explained.
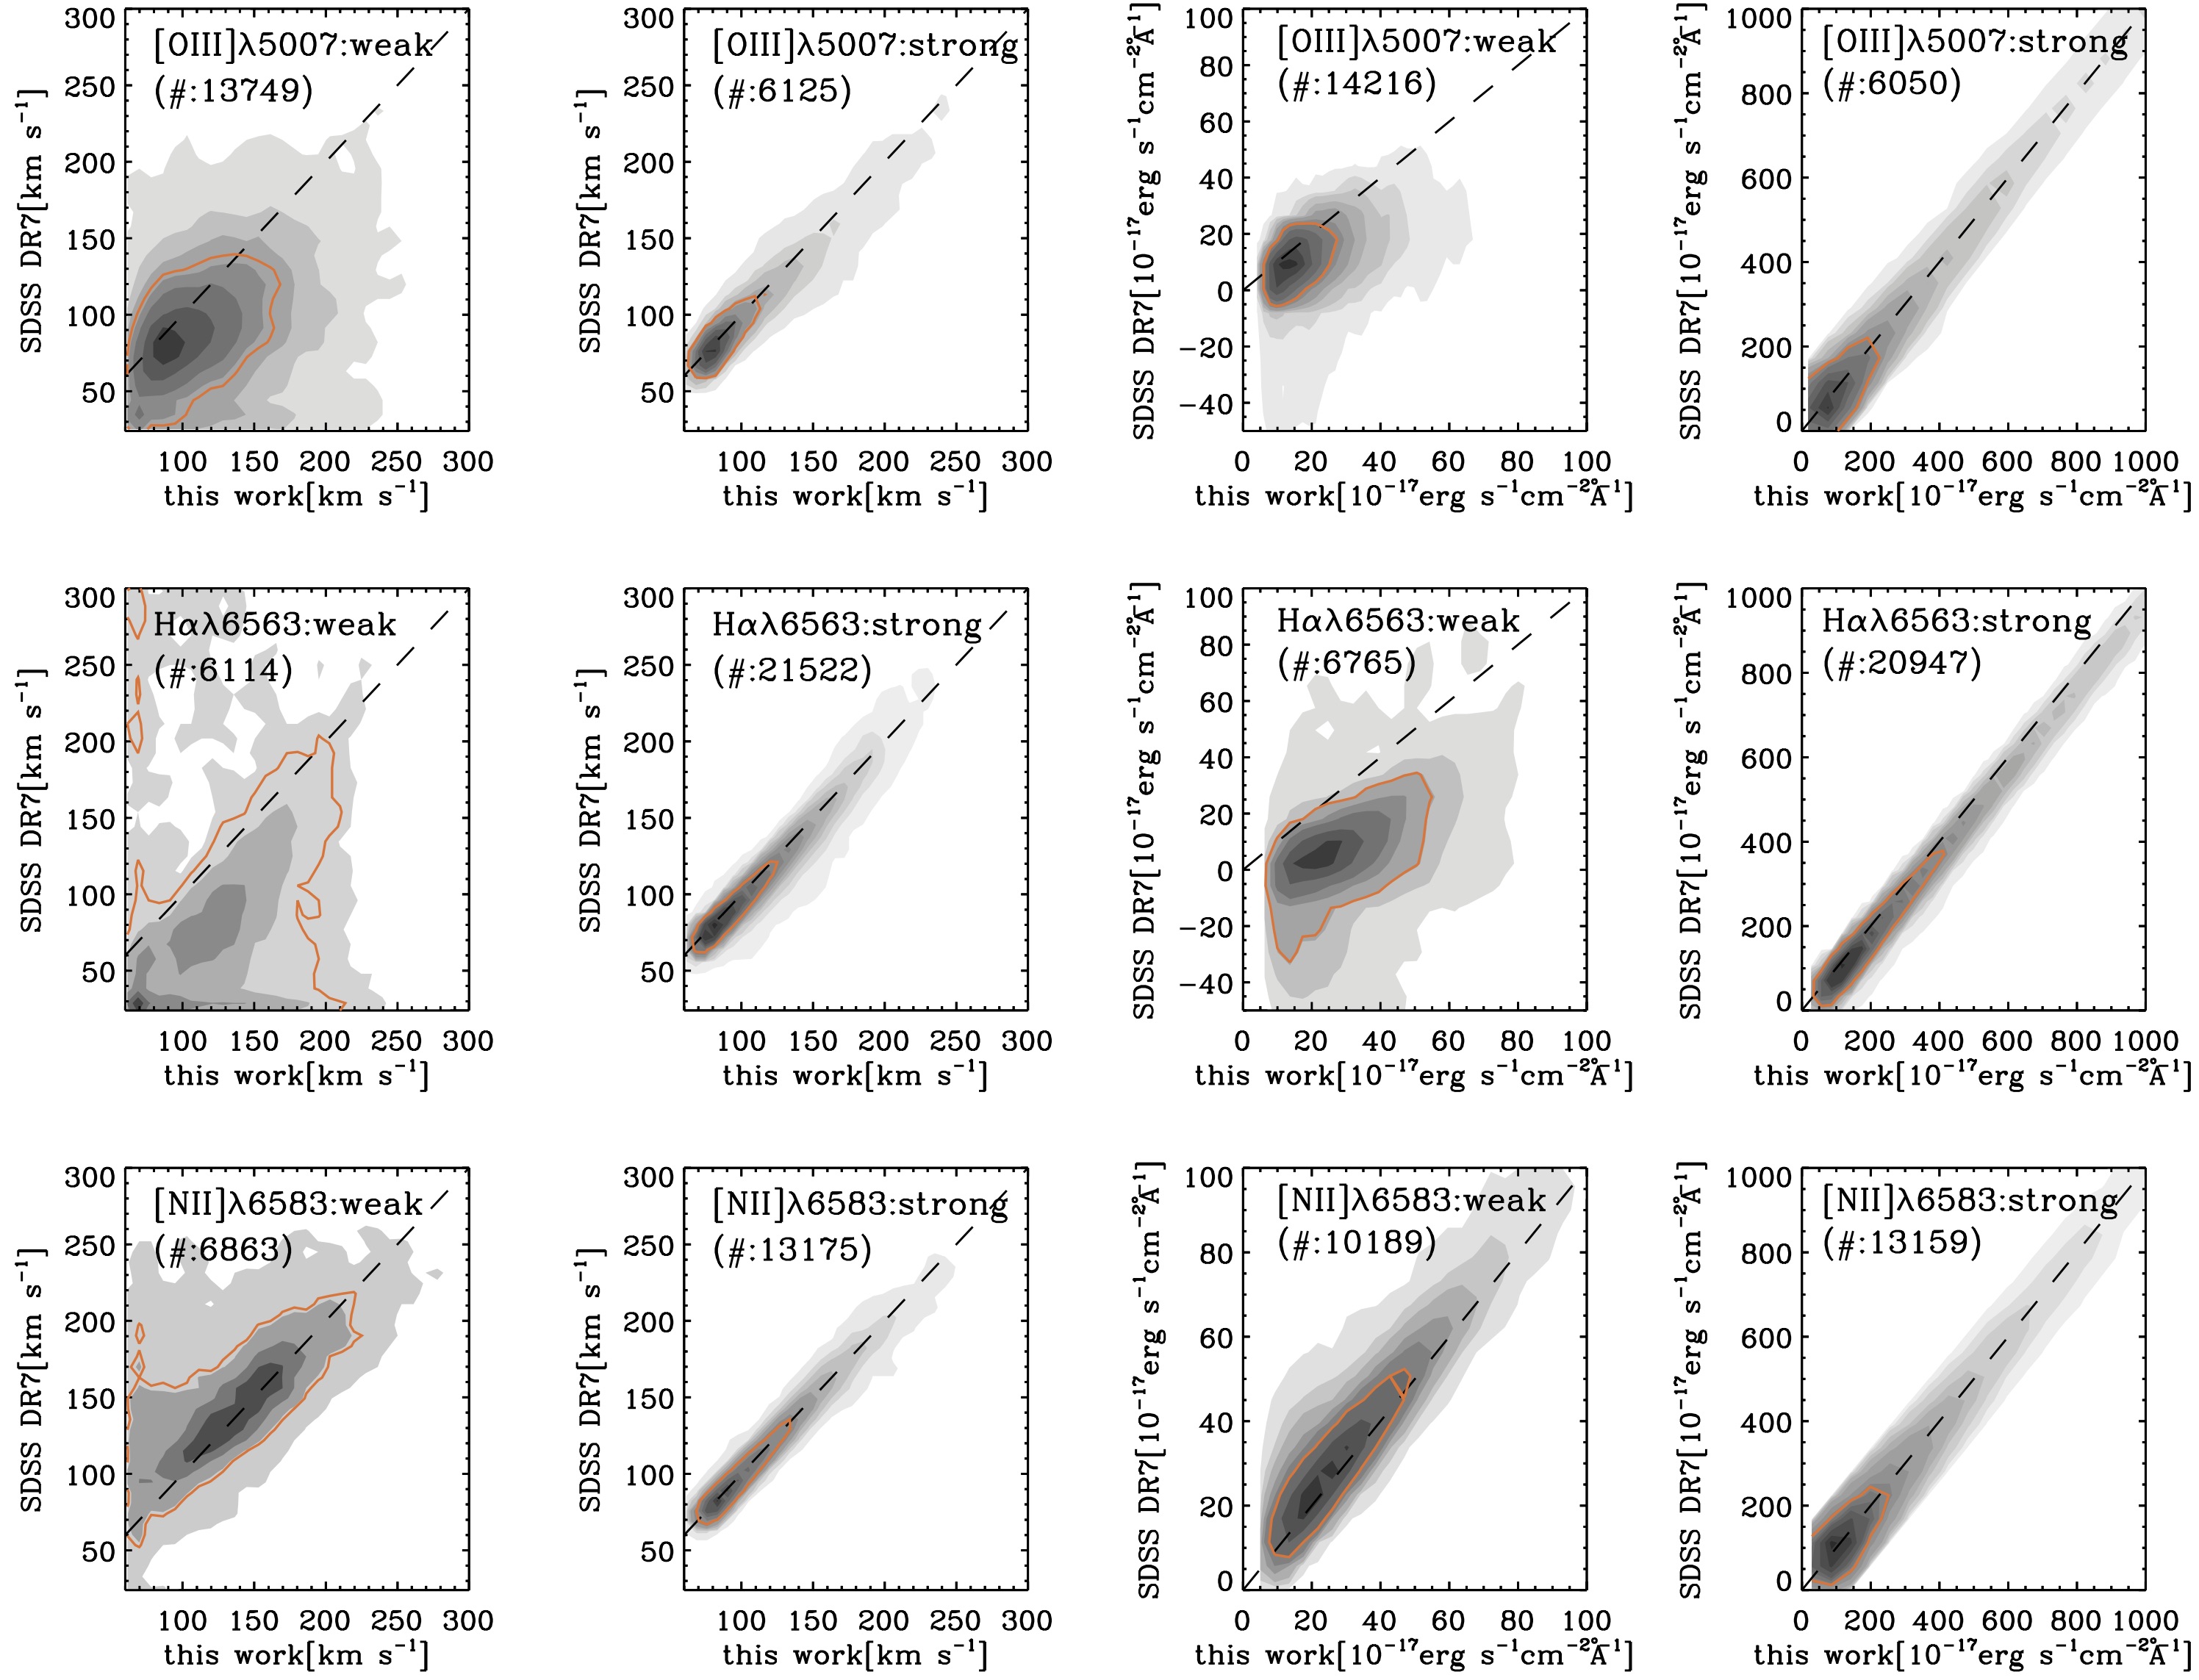
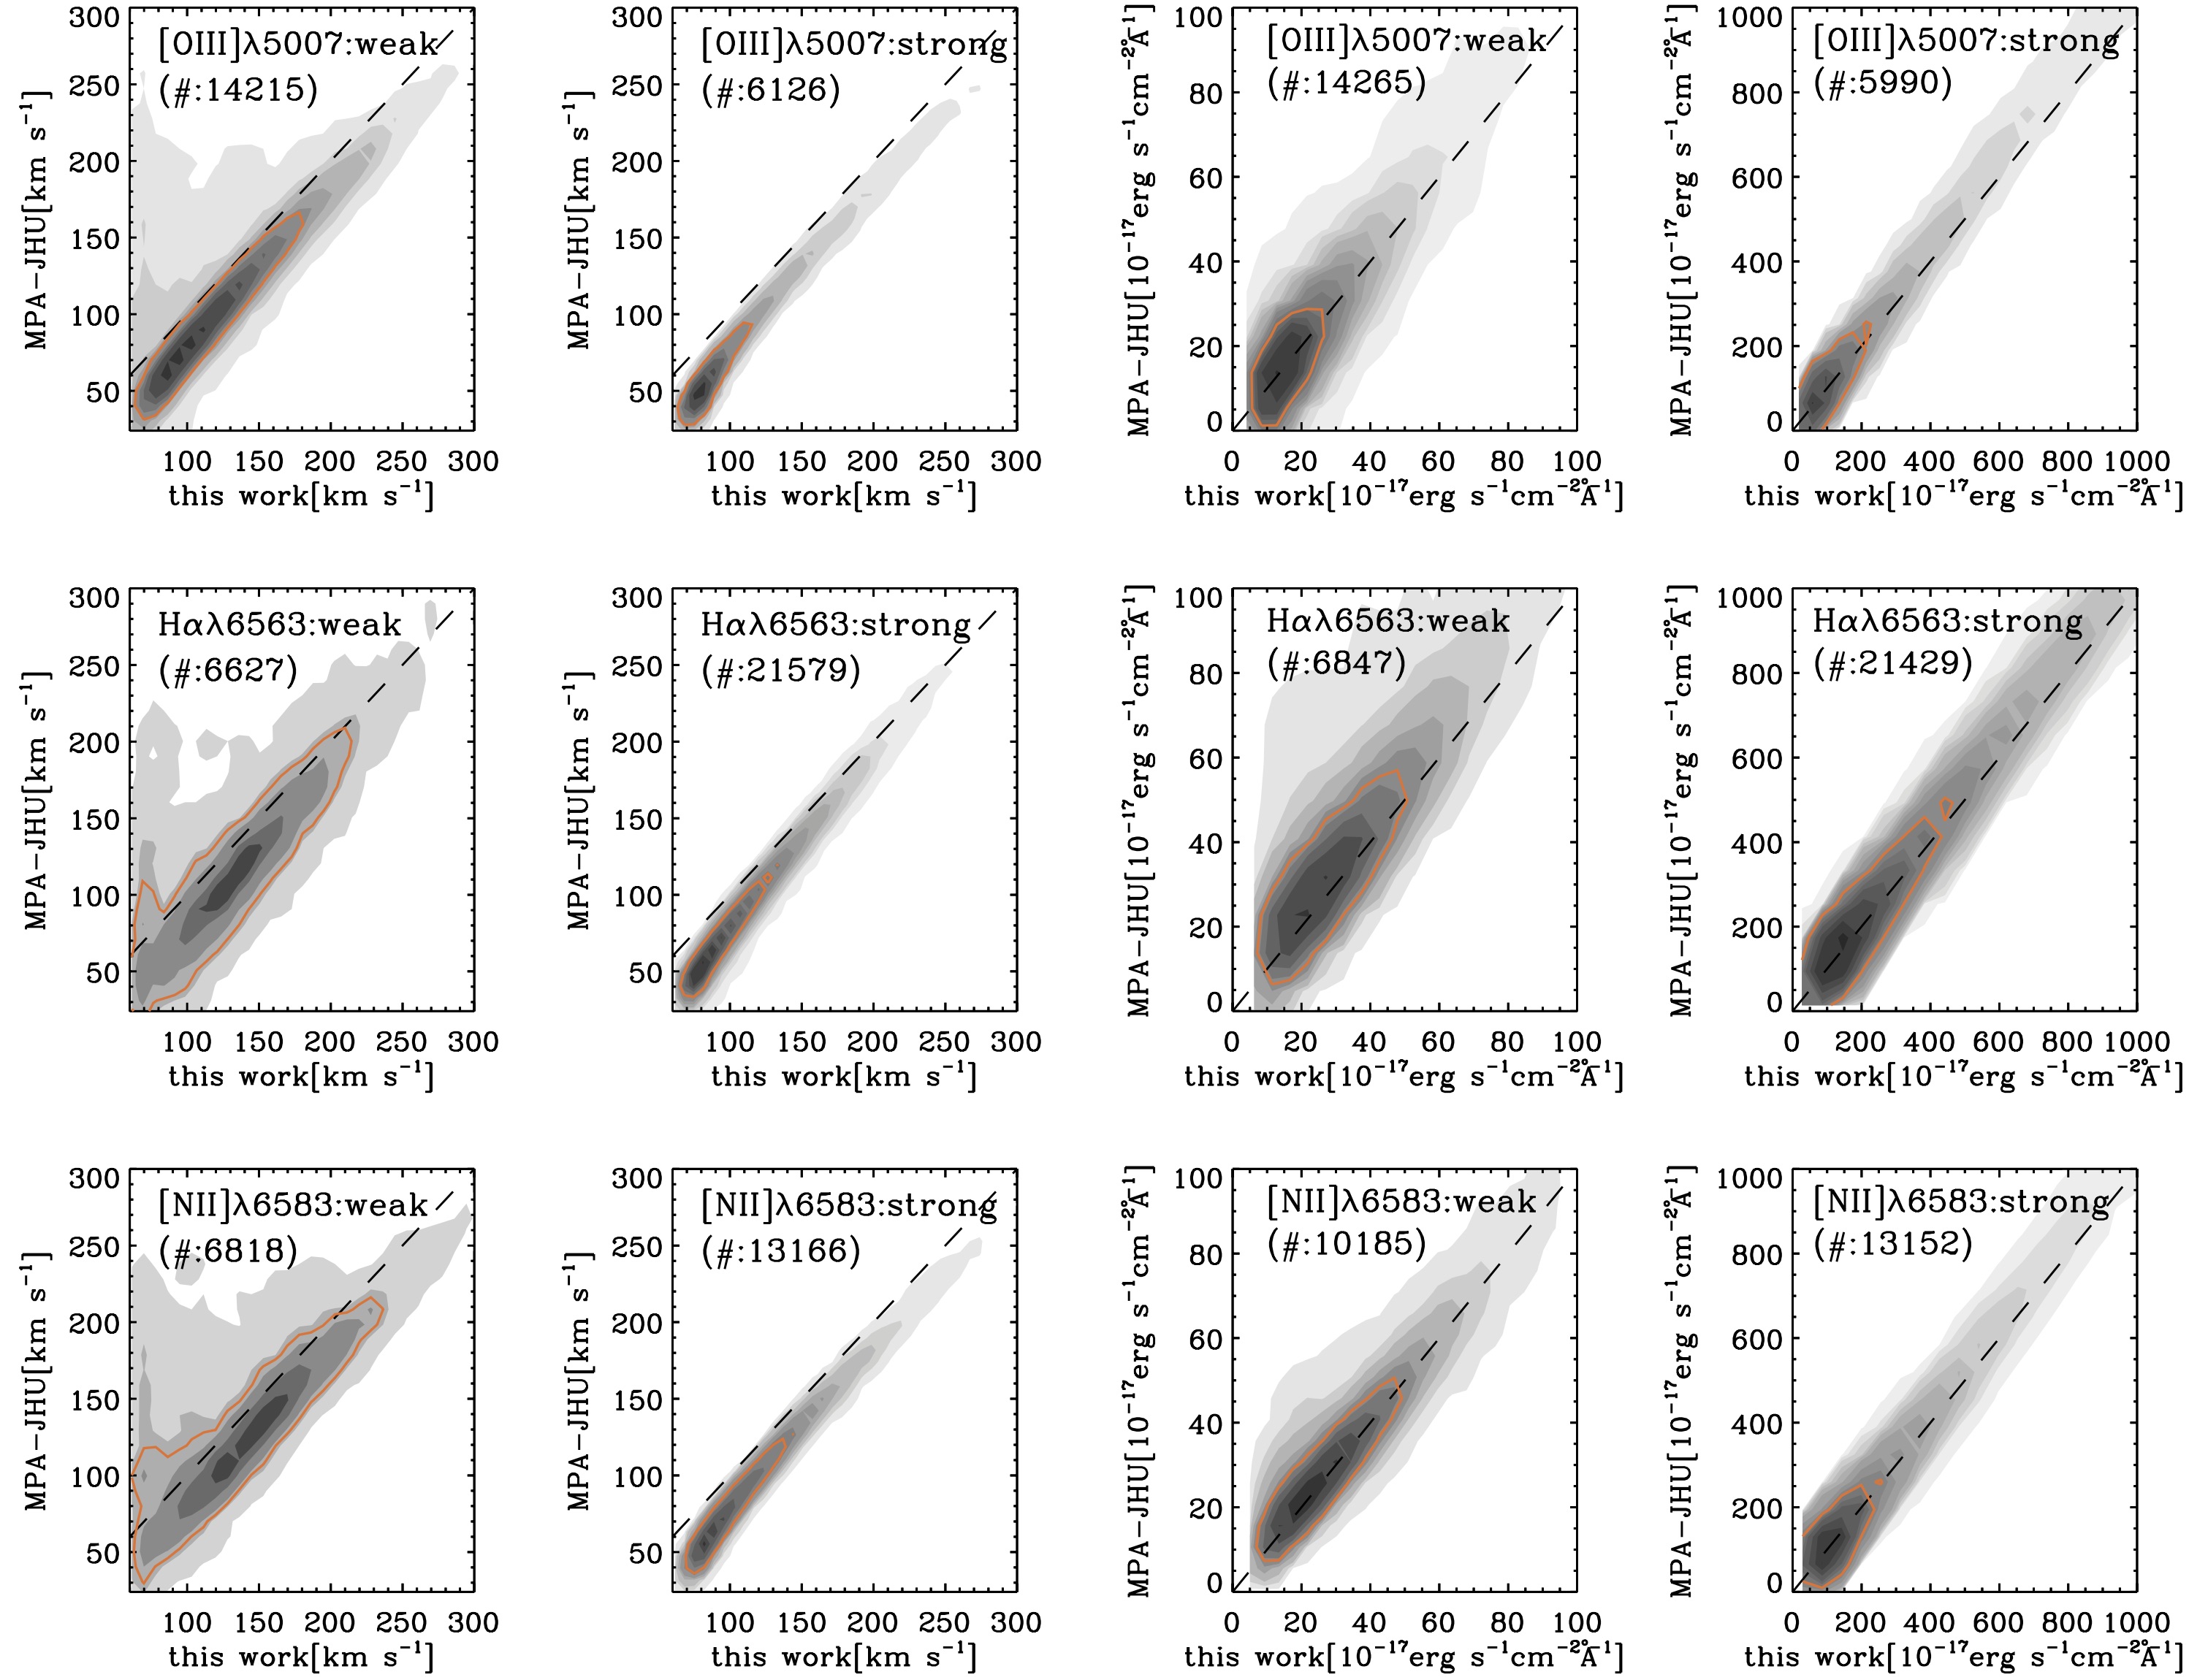
Continuing with the nebular fit, following figures show how our values for the width and the flux of strong lines such as [OIII], Hα and [NII] compare against the same quantities from the DR7 pipeline and the MPA-JHU catalog, respectively. When comparing our values to the DR7 and MPA-JHU measurements, we used observed and intrinsic line-widths, respectively, and in both cases the flux values that were still affected by reddening due to dust in the SDSS objects. We further corrected the DR7 fluxes for foreground galactic extinction to bring them in line with our and the MPA-JHU measurements, and brought the MPA-JHU fluxes back to their original values before the renormalisation for extended sources. Our line-width and flux measurements agreed fairly well with the DR7 measurements, in particular when the lines were strong and thus the manner by which the stellar continuum was accounted for should have had only a very limited impact on the emission-line width and flux estimation based on the Gaussian fits. Still, even at these regimes our Hα flux values appear to exceed the DR7 measurements by a few percent. Furthermore, as we consider weaker lines, the way the Hα flux measurements compared to each other appeared to be systematically biased, rather than being simply affected by a larger scatter due to larger relative errors on the measurements of weak lines in both the DR7 and our dataset, as seems to be the case for [OIII] and [NII]. Our flux values became systematically larger than the DR7 measurements as the Hα lines become weaker, which is to be expected given that we accounted for the presence of the underlying stellar spectrum and that in this regime the strength of the Hα emission became comparable to its corresponding stellar absorption feature. No such bias as a function of the emission-line strength was observed when we compared our Hα flux values with the MPA-JHU measurements, which do account for the stellar continuum, although our intrinsic Hα line-width values were larger than the MPA-JHU estimates. From the limited information provided with the MPA-JHU on-line catalog, it is difficult to understand the cause of such small deviations; however, in the strong-emission regime where the flux estimates should be consistent between all three databases, our values were in agreement with the DR7 values, whereas the MPA-JHU measurements were not.
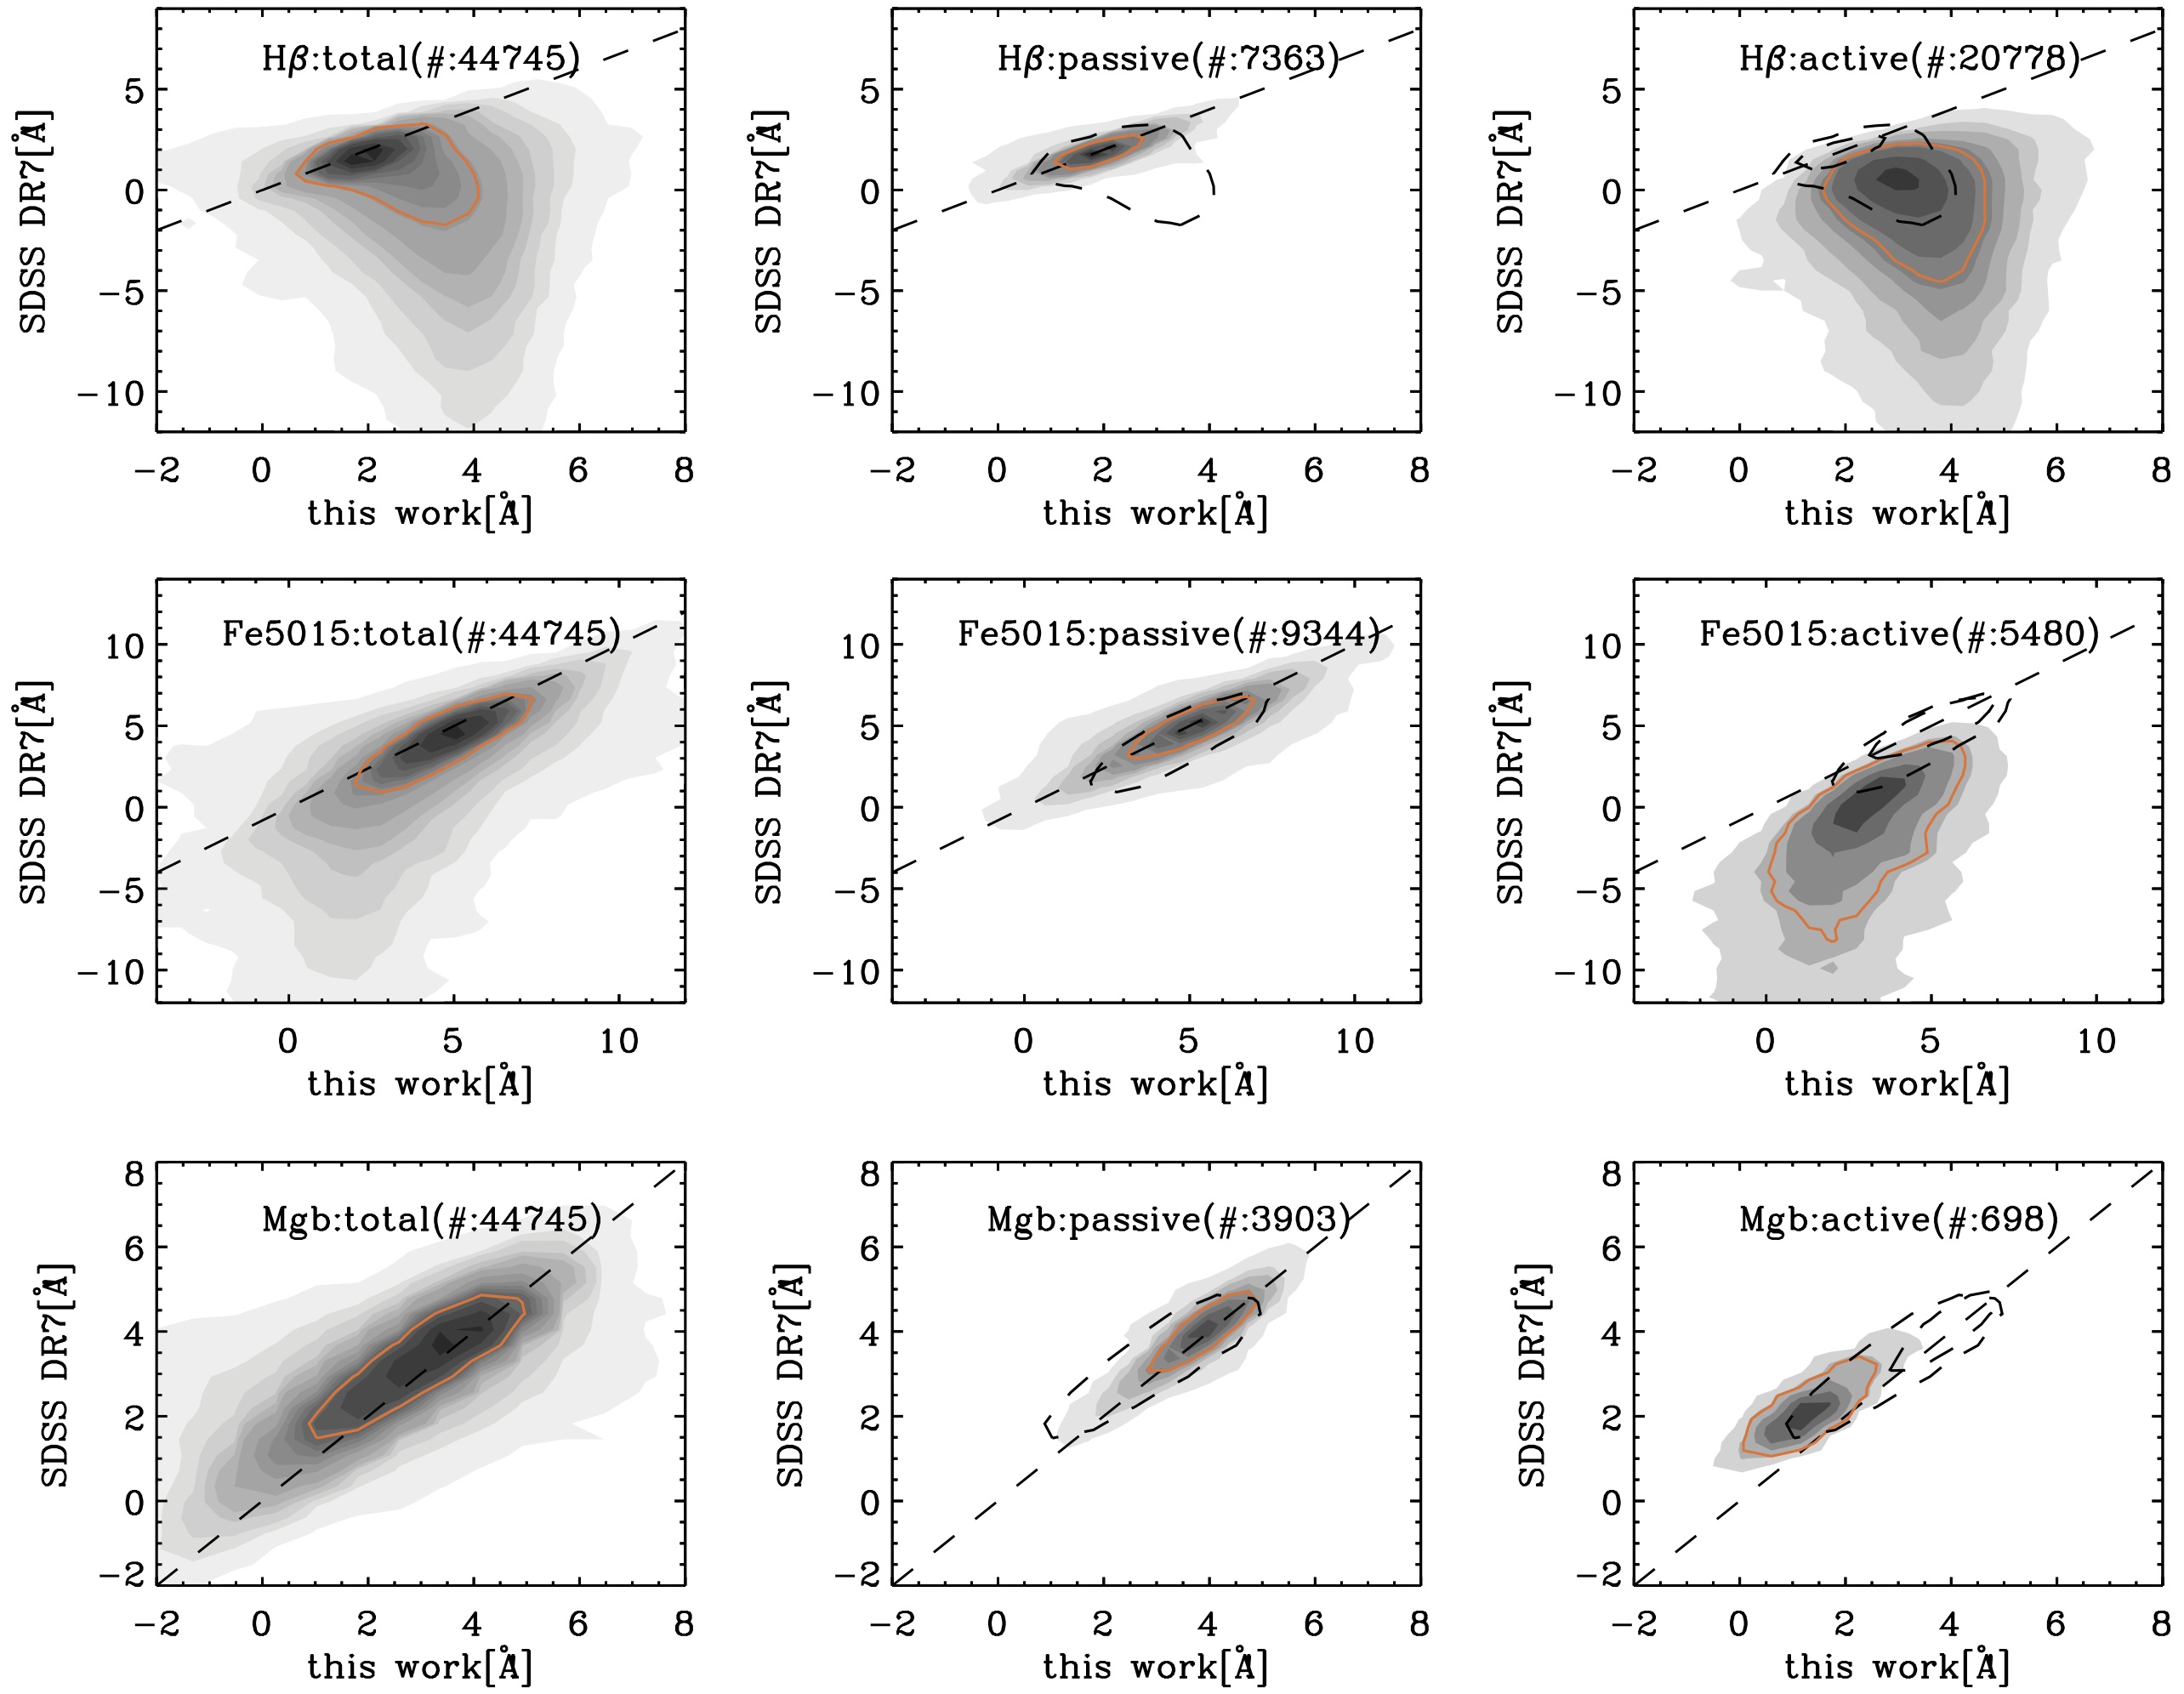
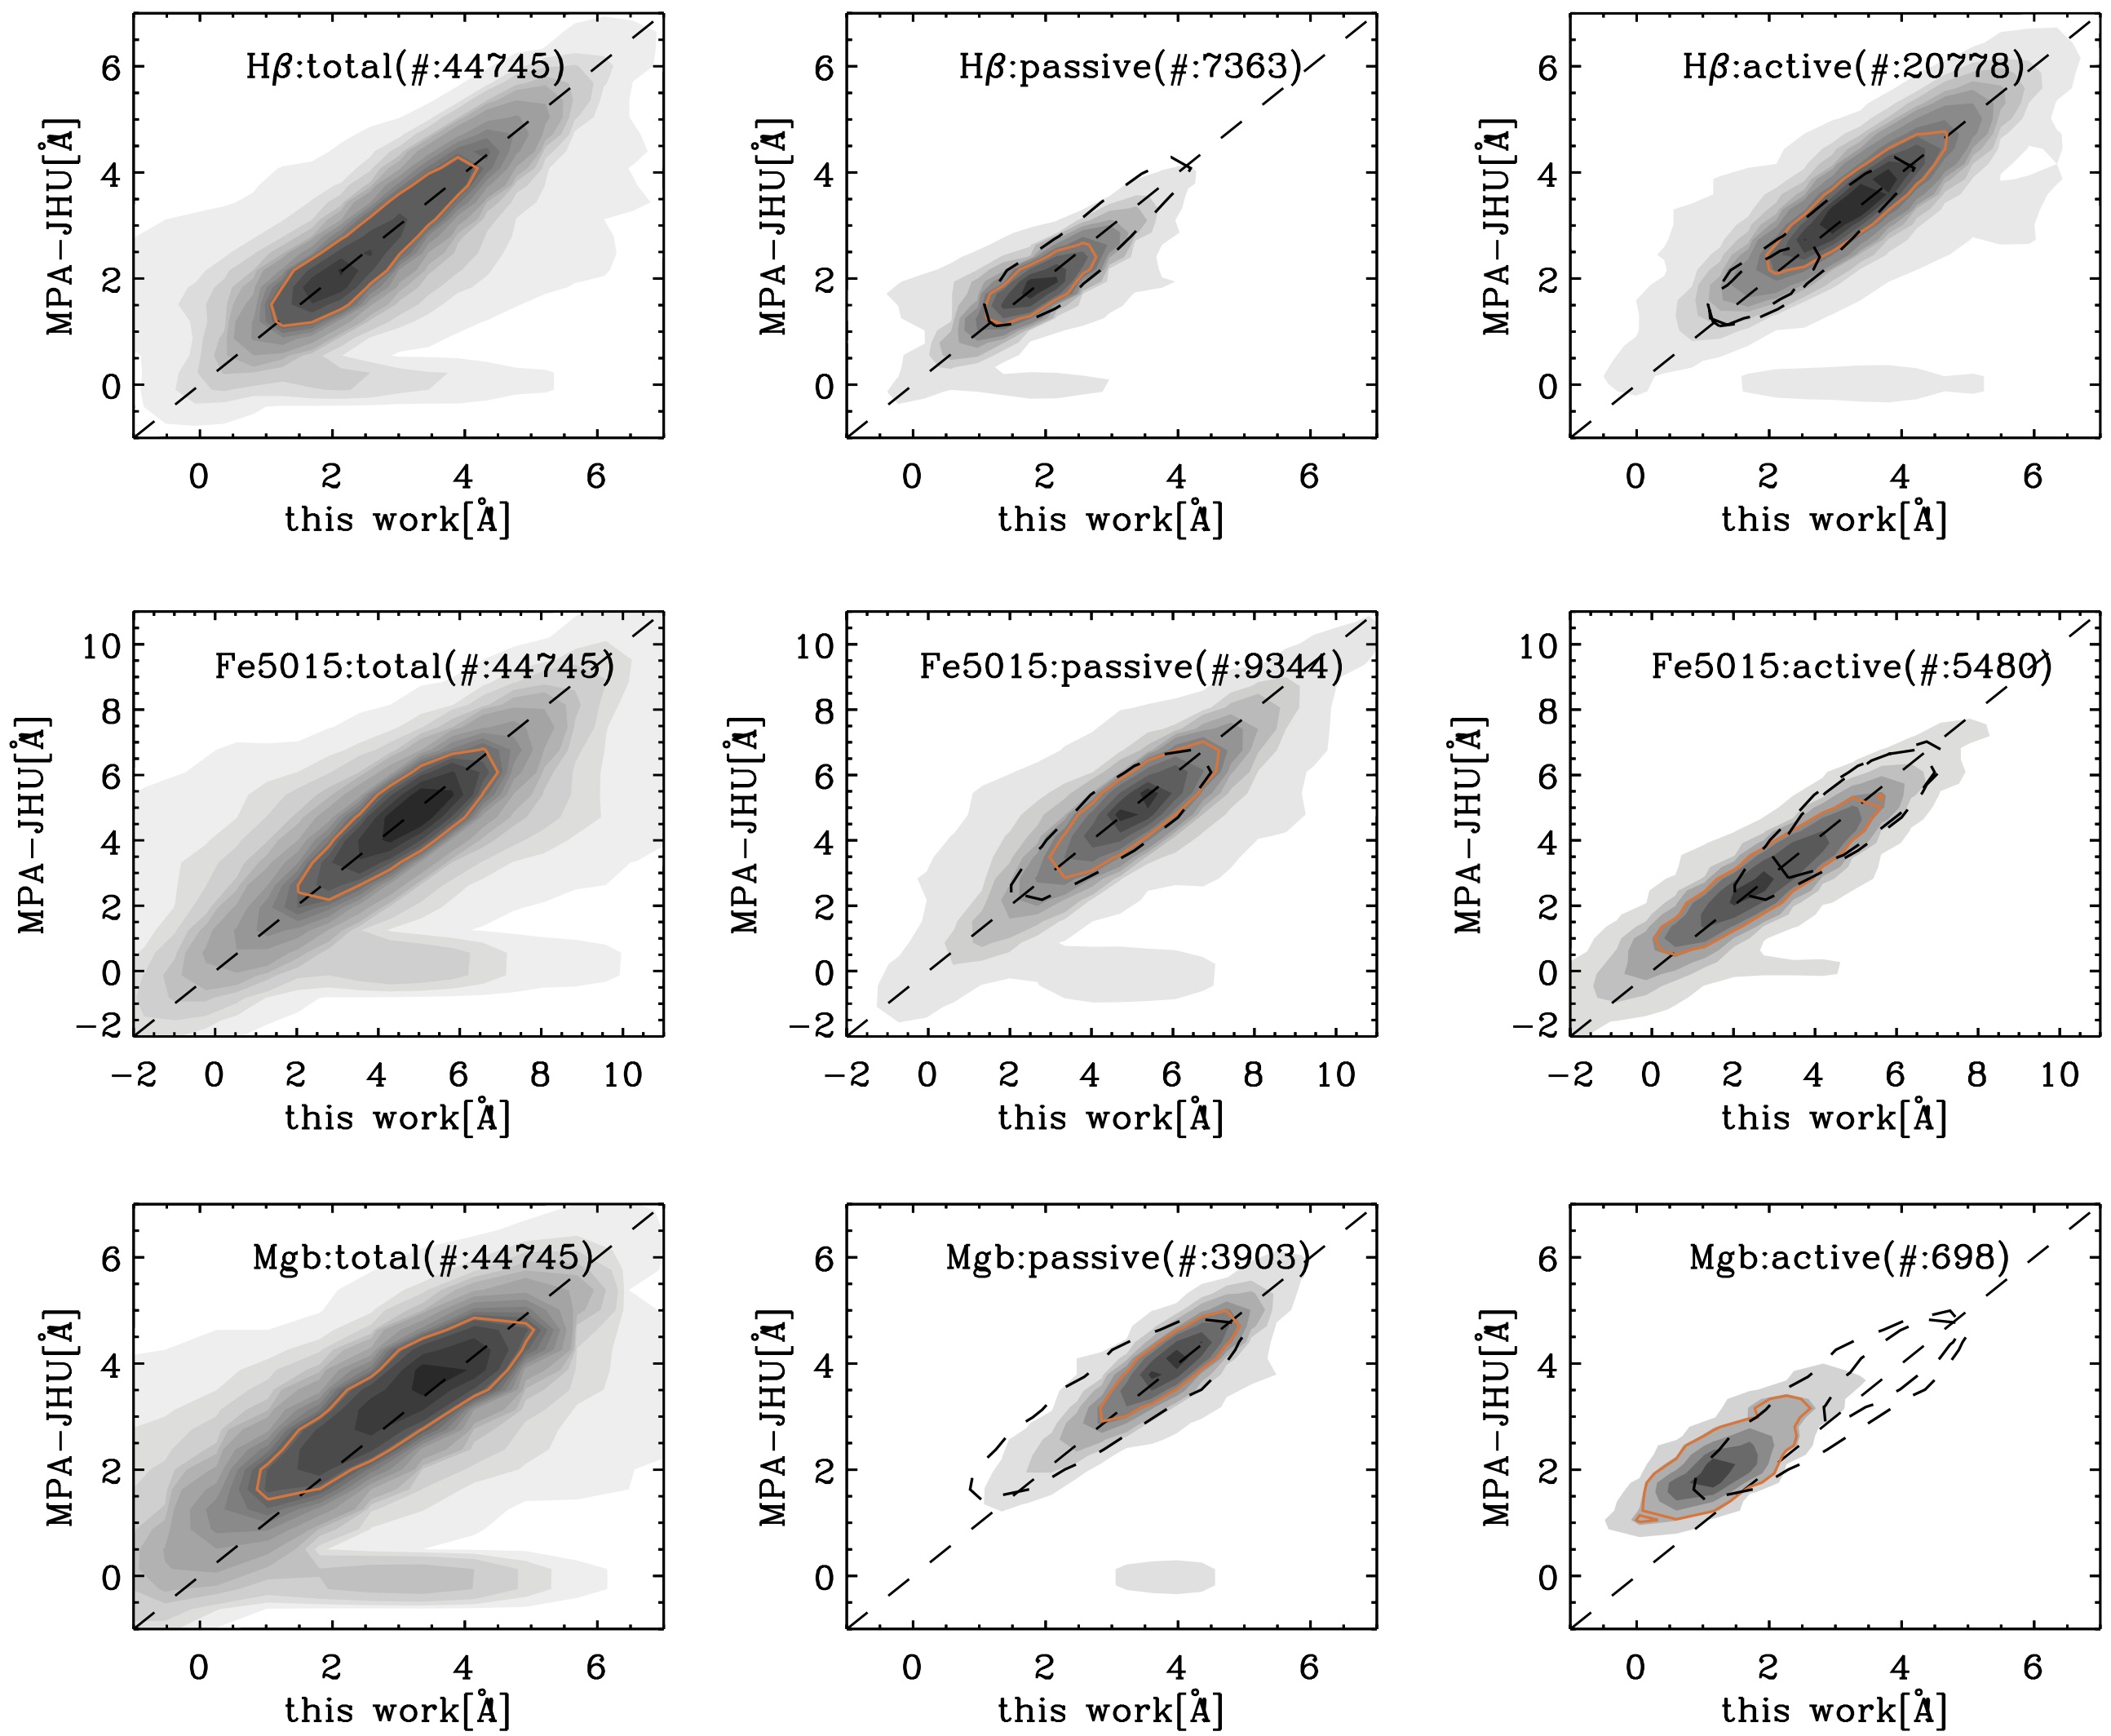
We conclude this comparison by presenting following figures, where we compare our line-strength measurements with the values for the same Lick indices provided by both the DR7 pipeline and the MPA-JHU catalogue. The DR7 release webpages specify that the DR7 measurements were made on the original SDSS spectra, without degrading their resolution to match the resolution of the Lick/IDS system. Furthermore, a first inspection of the objects with good quality spectra and that were completely devoid of emission revealed that this was also the case for the MPA-JHU measurements and that in both cases no attempt was made to correct the line-strength measurements for the impact of kinematic broadening. The central panels of the figures show how, for passive objects, our uncorrected measurements were well-matched with both catalogues. When objects with emission are considered, however, the DR7 values were heavily biased for the Lick indices where an emission line could fall either in the index passband or within the adjacent regions that were used to estimate the level of the pseudo-continuum above the absorption line region. In fact, during the DR7 pipeline analysis, the nebular emission was not subtracted prior to the line-strength measurements. When the emission-line fell within the index passband, as happened for the Hβ and [OIII] lines in the case of the Hβ and Fe5015 indices (top and central panels of figures, the strength of the absorption line was under-estimated. When the emission fell in one of the continuum passbands, as happened for the [NI] doublet in the case of the Mgb index (lower panels), the line-strength was over-estimated, as it was measured against an artificially enhanced pseudo-continuum level.