Fitting Quality Assessment

"High Signal-to-Noise ratio does not always guarantee a good fit"

Kyuseok Oh

Assessing the quality of our fits to the SDSS spectra is a key to the accuracy of our measurements for the stellar and gaseous kinematics, as well as for the strengths of both the emission and absorption lines. An inadequate model for the observed spectrum, or artificial features in the data themselves is likely to introduce biases to the measured parameters that are not accounted for by our formal errors. Such parameters are affected in different ways by data mismatches. For the stellar kinematics, and in particular for the velocity dispersion, the most crucial match is the stellar continuum across the entire wavelength range, whereas the accuracy of the emission-line parameters (and of the absorption-line indices that are affected by nebular emission) are more sensitive to the quality of the fit in more localized spectral regions around the emission lines. The quality of the data, as routinely estimated by dividing the average level of the flux density (hereafter S, for signal) by the level of the formal uncertainties for the latter (hereafter sN, for statistical noise), does not guarantee a good fit. Artifacts introduced during data reduction may not be picked up by such an S/sN ratio, whereas a severe template mismatch to the stellar continuum or the presence of additional components in the nebular spectrum (e.g., a Broad Line Region or Wolf-Rayet features that are not included in our standard fitting procedure) may lead to biased results, even in a case of excellent data. A more direct way to assess the quality of our model would be to compare the level of fluctuations in the fit residuals (hereafter rN, for residual noise) to the expected statistical fluctuations, sN. A rN/sN ratio close to unity indicates a good fit, as this ration corresponds to a reduced Χ2, which is also close to 1.
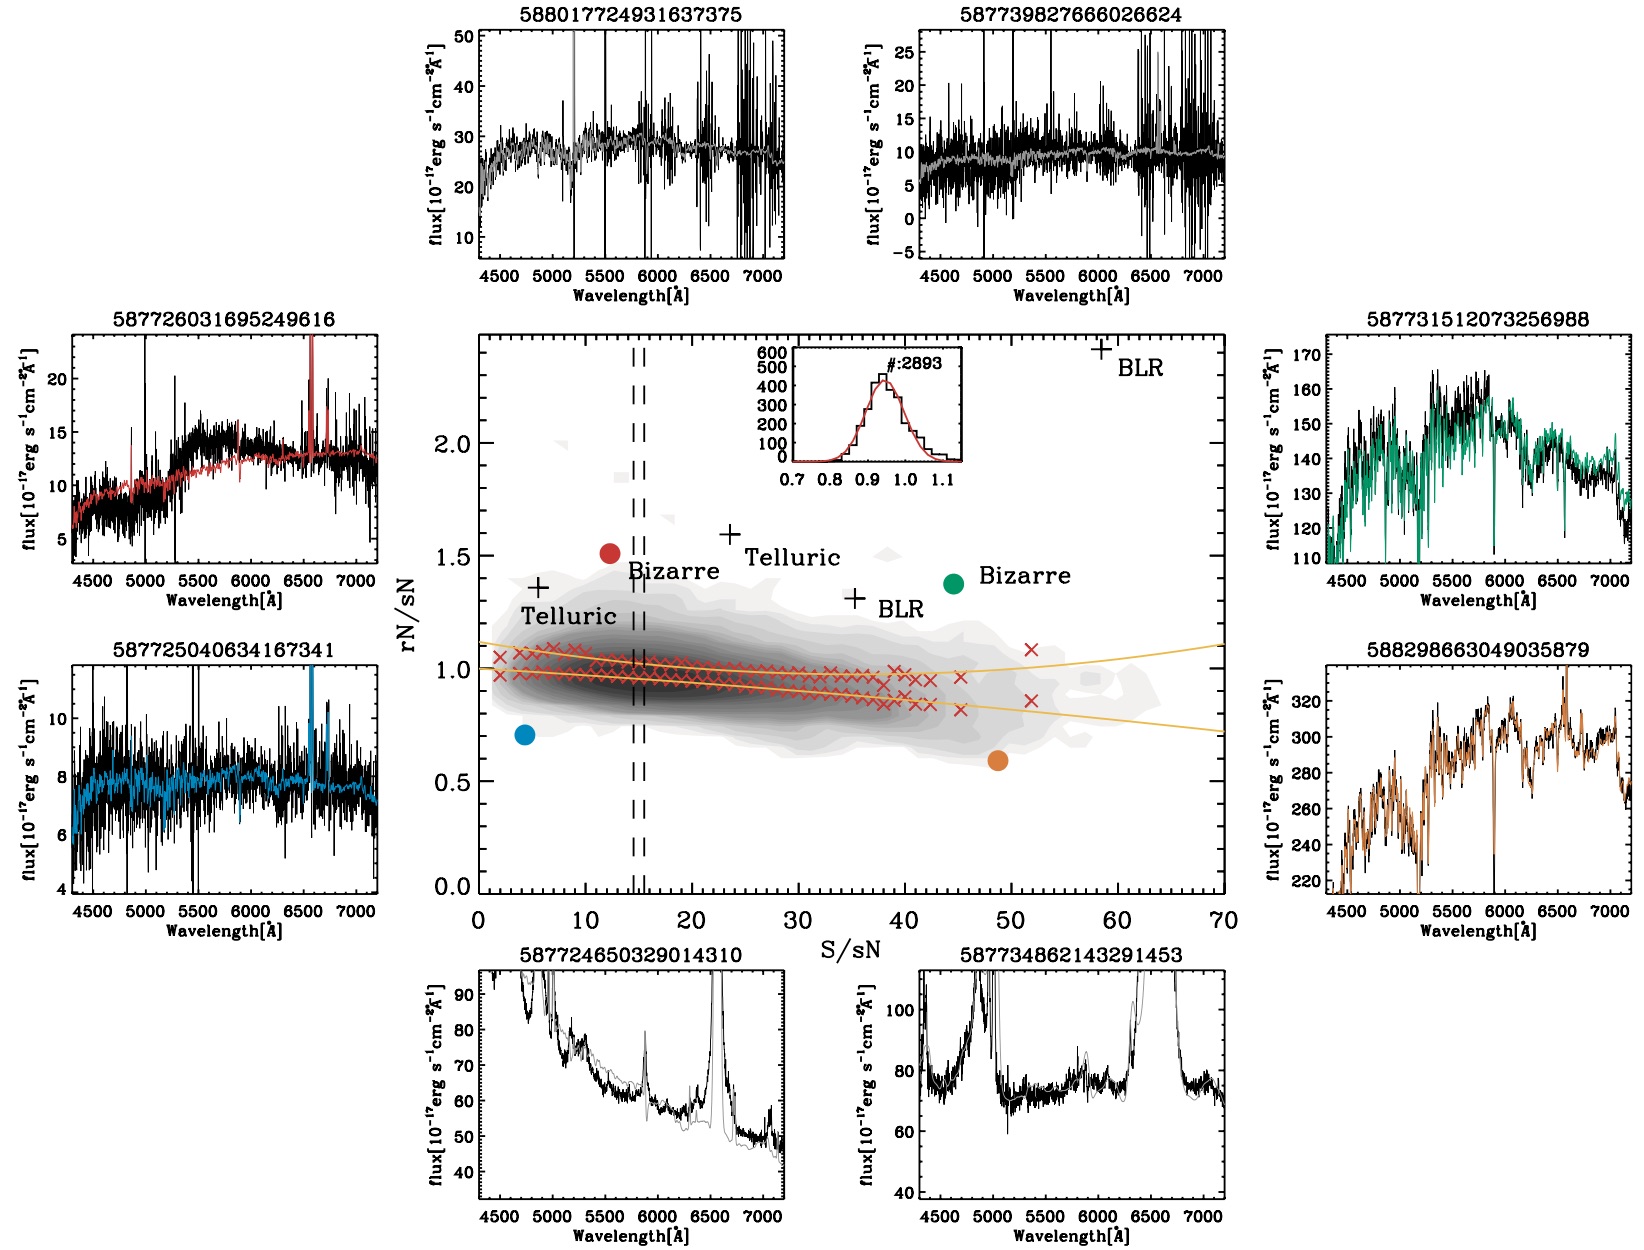
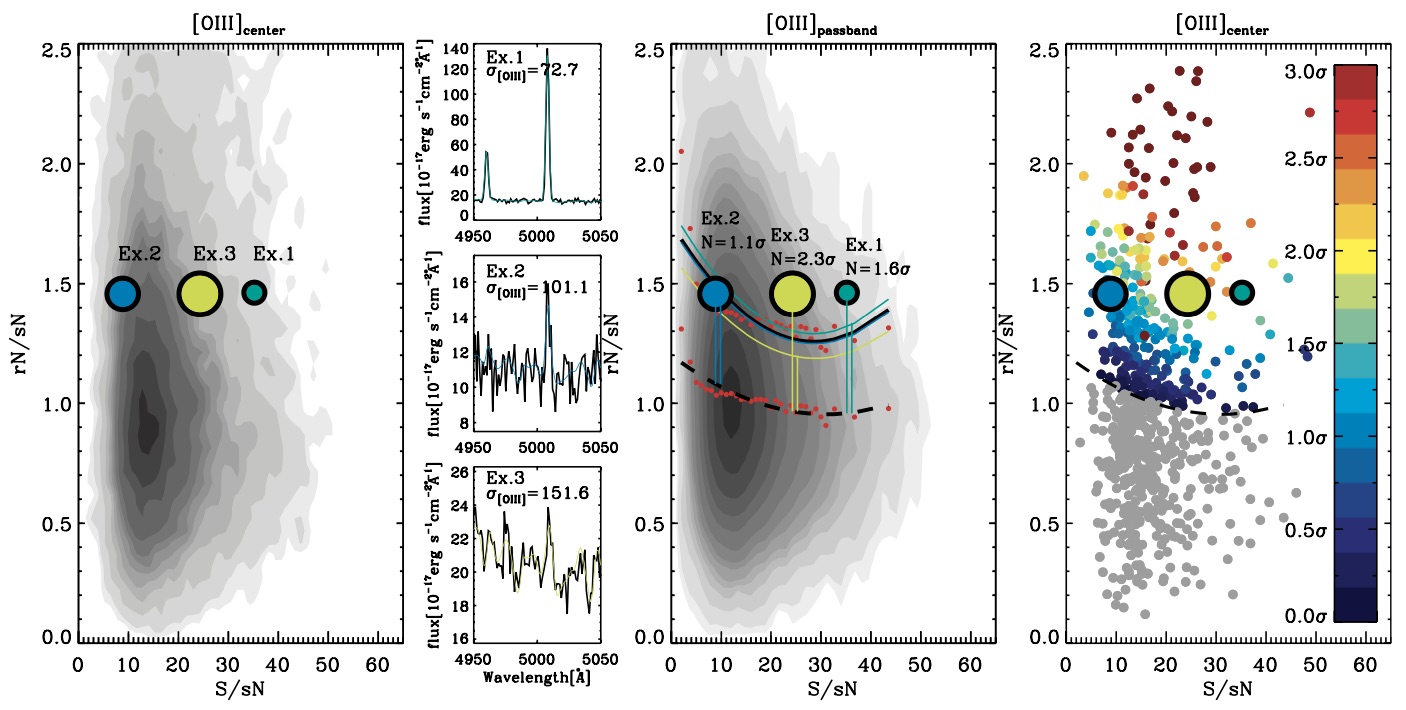
Figure: Quality assessment for continuum with examples inducing bad fits. This figure shows a quality assessment for a continuum region using randomly selected ~46,000 objects. Red crosses on the central panel denote the median (lower) and 1 σ(upper) distribution for each S/sN bin and orange solid lines fit (note that there is a demarcation line for 1 σ in the direction of larger rN/sN.). The vertical dashed lines indicate a specific bin and its Gaussian distribution has been inserted on the top side as an example. The color filled dots correspond to the colored left and right panels and clarify the trend for quality assessments. The black solid lines represent the observed spectra and the coloured lines are the fits. Furthermore, the top and bottom examples with gray fits are the major reasons for the bad fits. These telluric contaminated spectra (top) and Broad Line Regions (bottom) are marked with black crosses on the central panel. A minor reason which brought about bad fits is also denoted by red and green filled dots. Figure : Quality assessment process for [OIII] with three examples. Left : The quality assessment plane drawn by a central emission region using randomly selected ~46,000 objects. The three examples which have different emission line widths are shown as Ex.1,2 and 3. Middle : Quality assessment plane given by a typical passband. The lower and upper red filled dots are the median and 1 σ at each S/sN bin. The black dashed and solid lines trace each point. Moreover, [OIII] emissions for these three examples are shown on left sub-panels in corresponding colors. The black line represents the observed spectrum and the colored one the fit. Once we derived the median and 1 σ from the typical passband, we measured the Nσ of every [OIII] emission. The newly derived 1 σ are also shown using the same colors. Right : 1,000 objects shown in different colors depend on Nσ. The objects below the median are indicated in gray.