Error measurements
Typical errors of absorption-line indices
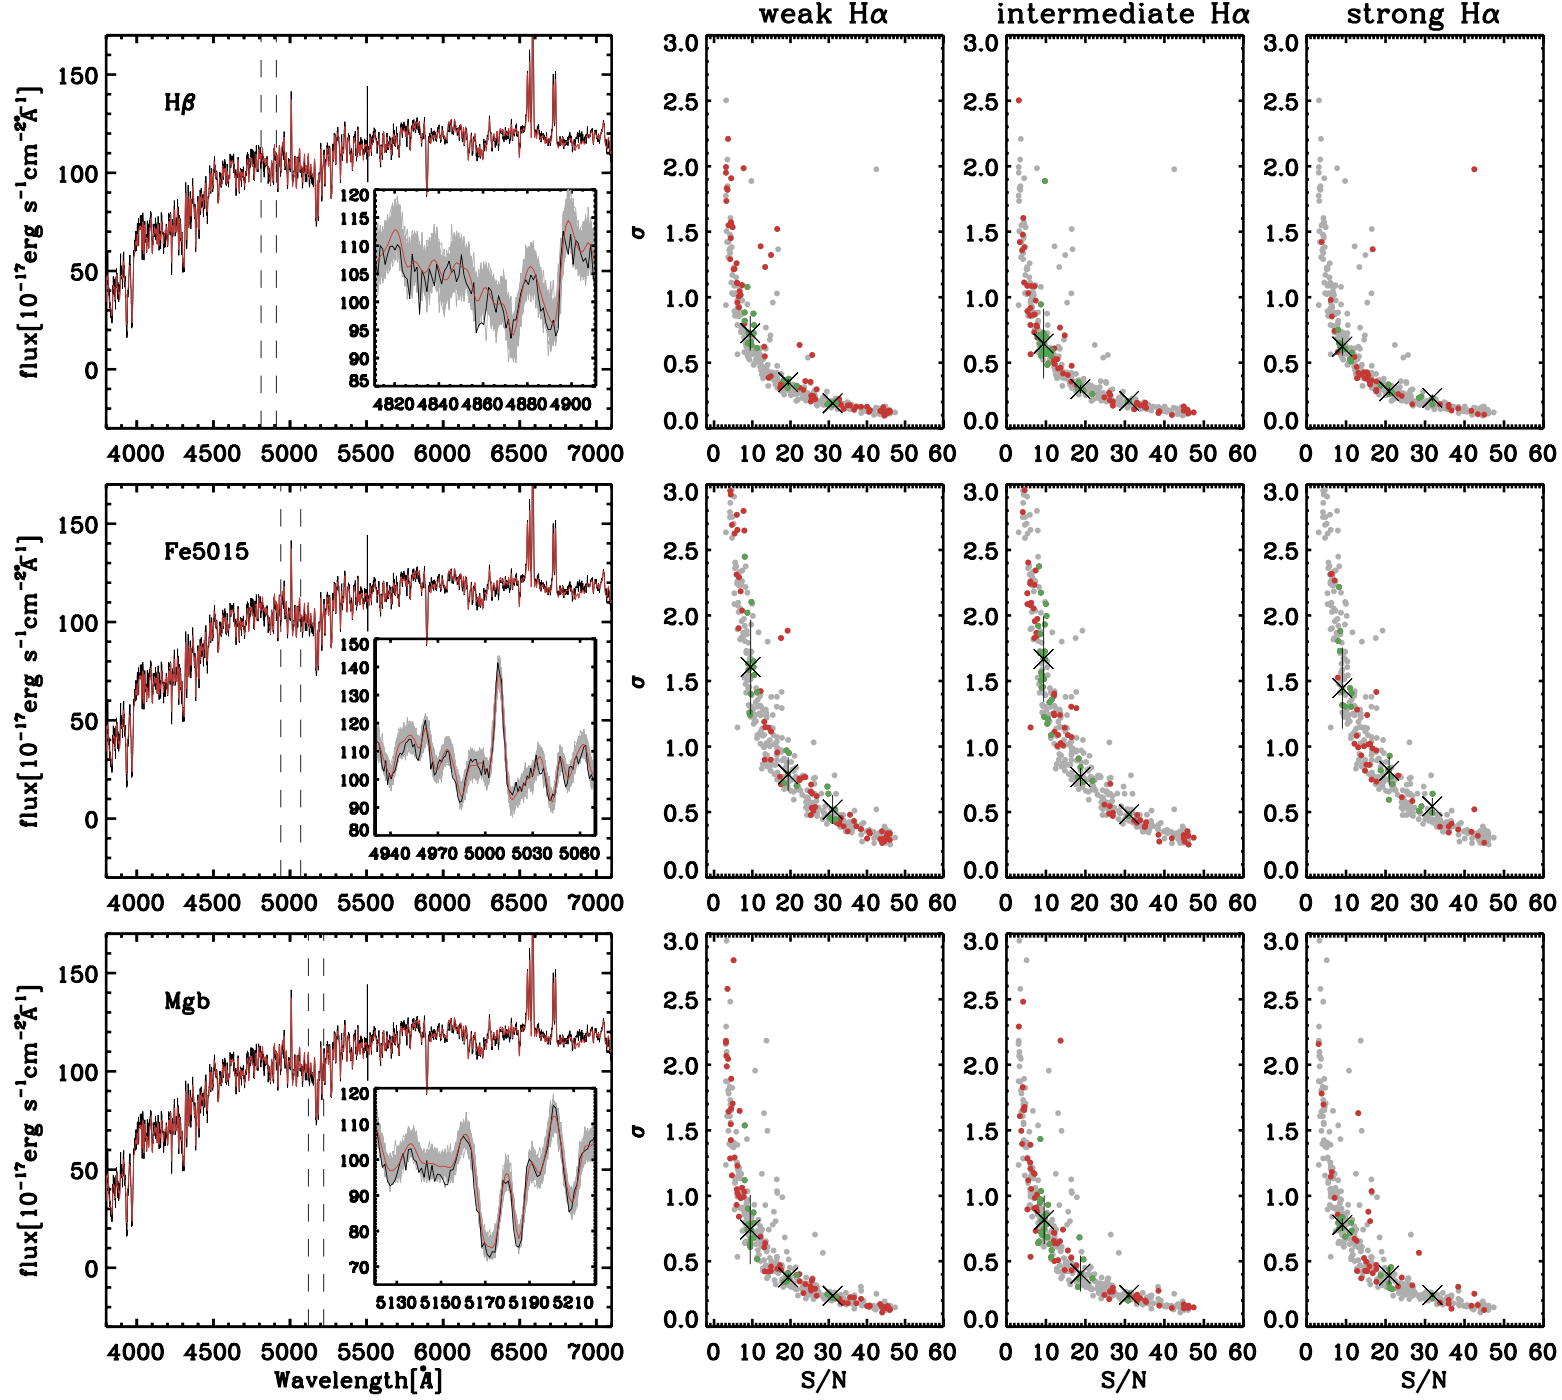
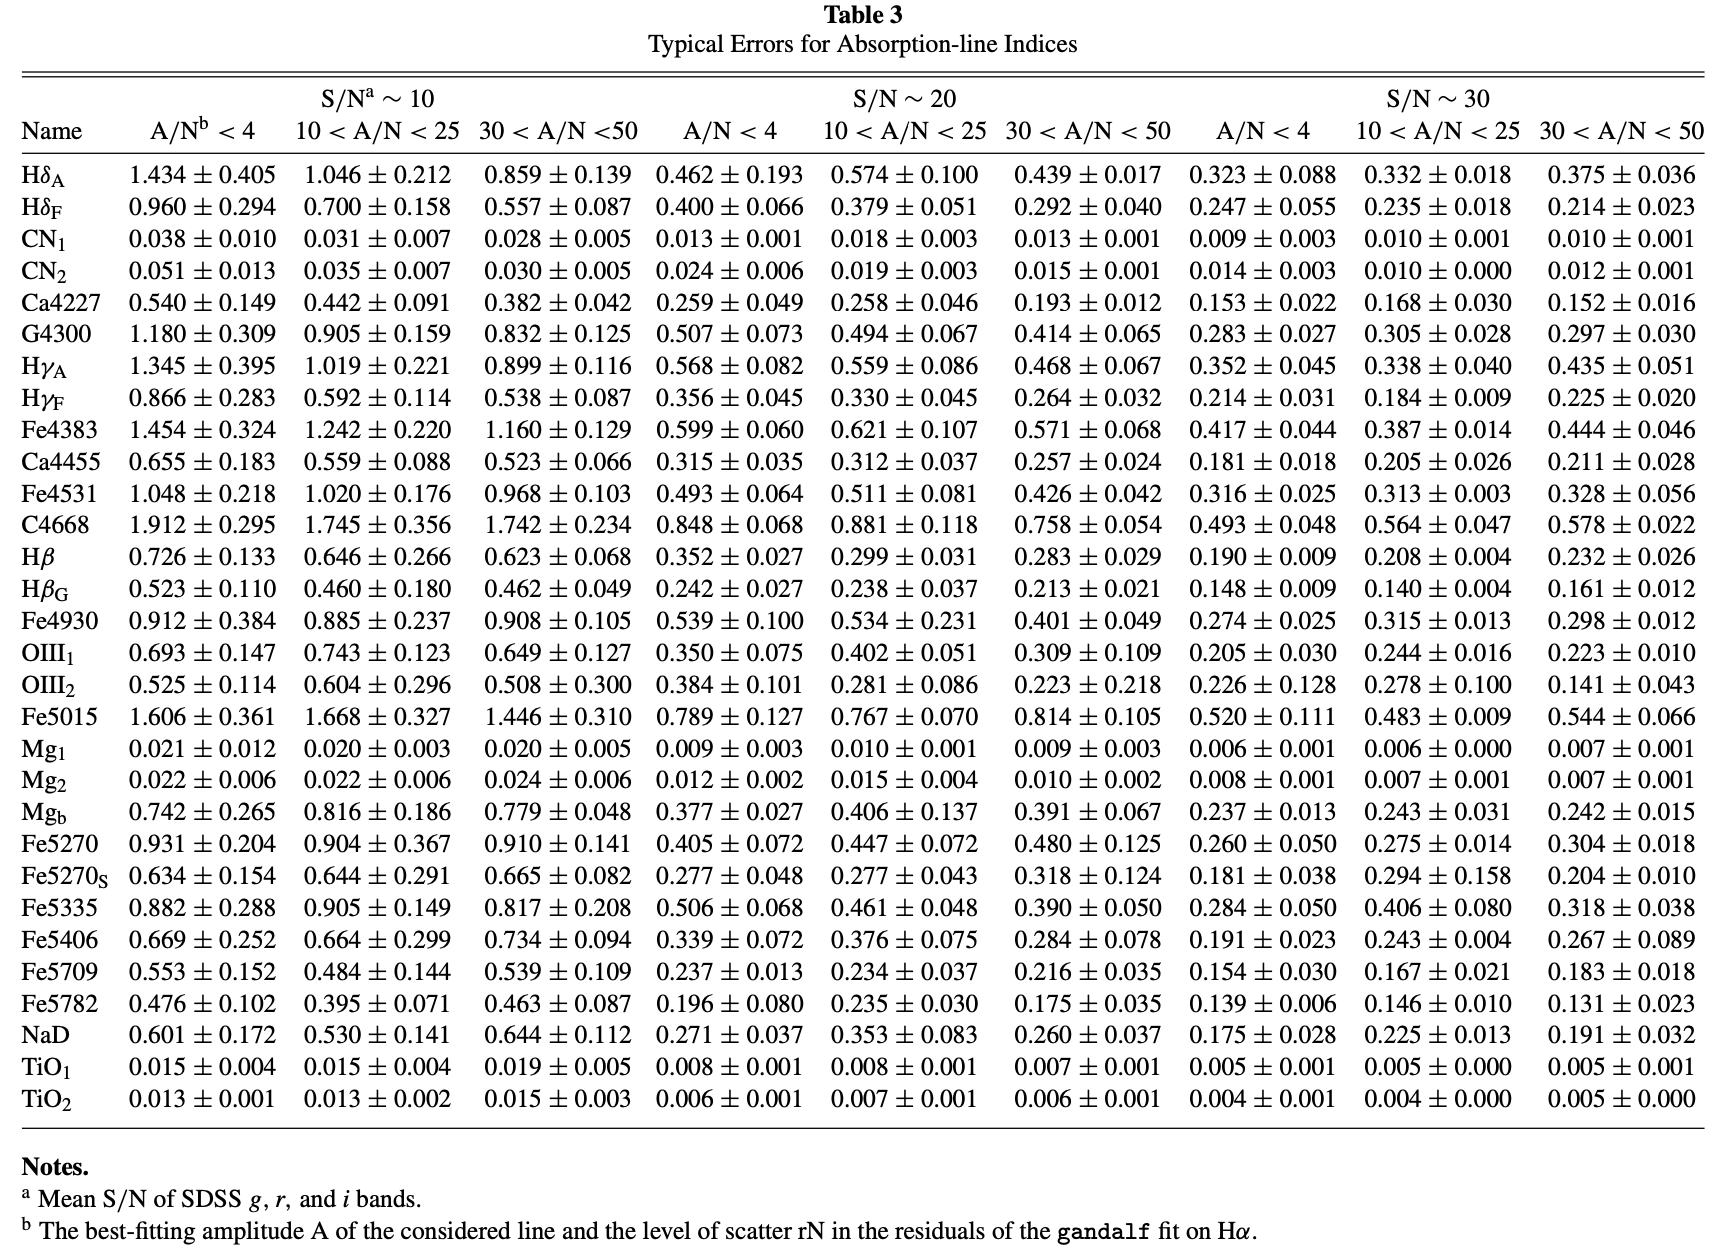
Both the pPXF and GANDALF returned formal errors for the stellar and gaseous kinematics and the flux values of the fitted emission lines. From MonteCarlo simulations based on synthetic spectra created from our best GANDALF fit to a subsample of galaxies in our catalogue and the formal uncertainties of their SDSS spectra, we verified that the formal uncertainties were consistent with the scatter of the parameter estimations obtained from fitting the synthetic spectra. Errors on the line-strength indices for each single object in our database would be more cumbersome to compute. In fact, although the impact of the statistic uncertainties on the flux densities of the SDSS spectra could be easily described in terms of formal errors in the line indices, the knock-on effect of the uncertainties on the stellar kinematics and - most importantly - on the GANDALF emission-line fit would require a MonteCarlo simulation in order to be properly estimated. Since this is not viable for nearly 700,000 objects, we decided instead to attach to any given line-index measurement in the objects of our catalogue the typical uncertainty that is measured in spectra showing a similar quality, a similar stellar kinematic broadening and strength of the emission falling in the pseudo-continuum of index passband of the considered index. To derive such typical errors, we selected a large number of SDSS spectra covering a wide range in quality (quantified by the average value of the S/N ratio between the values of the flux density and the statistical SDSS errors on them), of values of the stellar velocity dispersion, and of strength for the emission possibly affecting the line indices (e.g., [OIII] for Fe5015). The strength of the emission lines was quantified by the ratio A/rN of the best fitting amplitude A of the considered line and the level of scatter rN in the residuals of the GANDALF fit. Based on our best GANDALF fit for these objects and the formal SDSS errors on the flux densities, we created a number of synthetic spectra with a slightly different kinematic broadening and nebular emission, as allowed by the formal uncertainties on the pPXF and GANDALF parameters, and re-ran our entire analysis on them to obtain new values for the line-indices. By re-matching each of these synthetic spectra and subsequently measuring the line-strength index after subtracting our best model for the nebular emission, we obtained a range of absorption-line strength values and the corresponding 1 σ errors. The scatter of such synthetic line-index values around the one measured on the original spectra provided us with the typical errors on the line-strength measured in our catalogue. Figure 1 shows how their values vary as a function of S/N, velocity dispersion and - when applicable, the A/N of the contaminating lines. Furthermore, despite the presence of nebular emission, the error budget in the absorption-line indices is chiefly dominated by the quality of the spectra themselves. The formal uncertainties are also provided for the values of both reddening components included in our GANDALF fit. The typical errors for absorption-line indices are listed in Table 3.