A new catalog of type 1 AGNs and its implications on the AGN unified model
hidden type 1 AGNs that revealed by a dedicated work
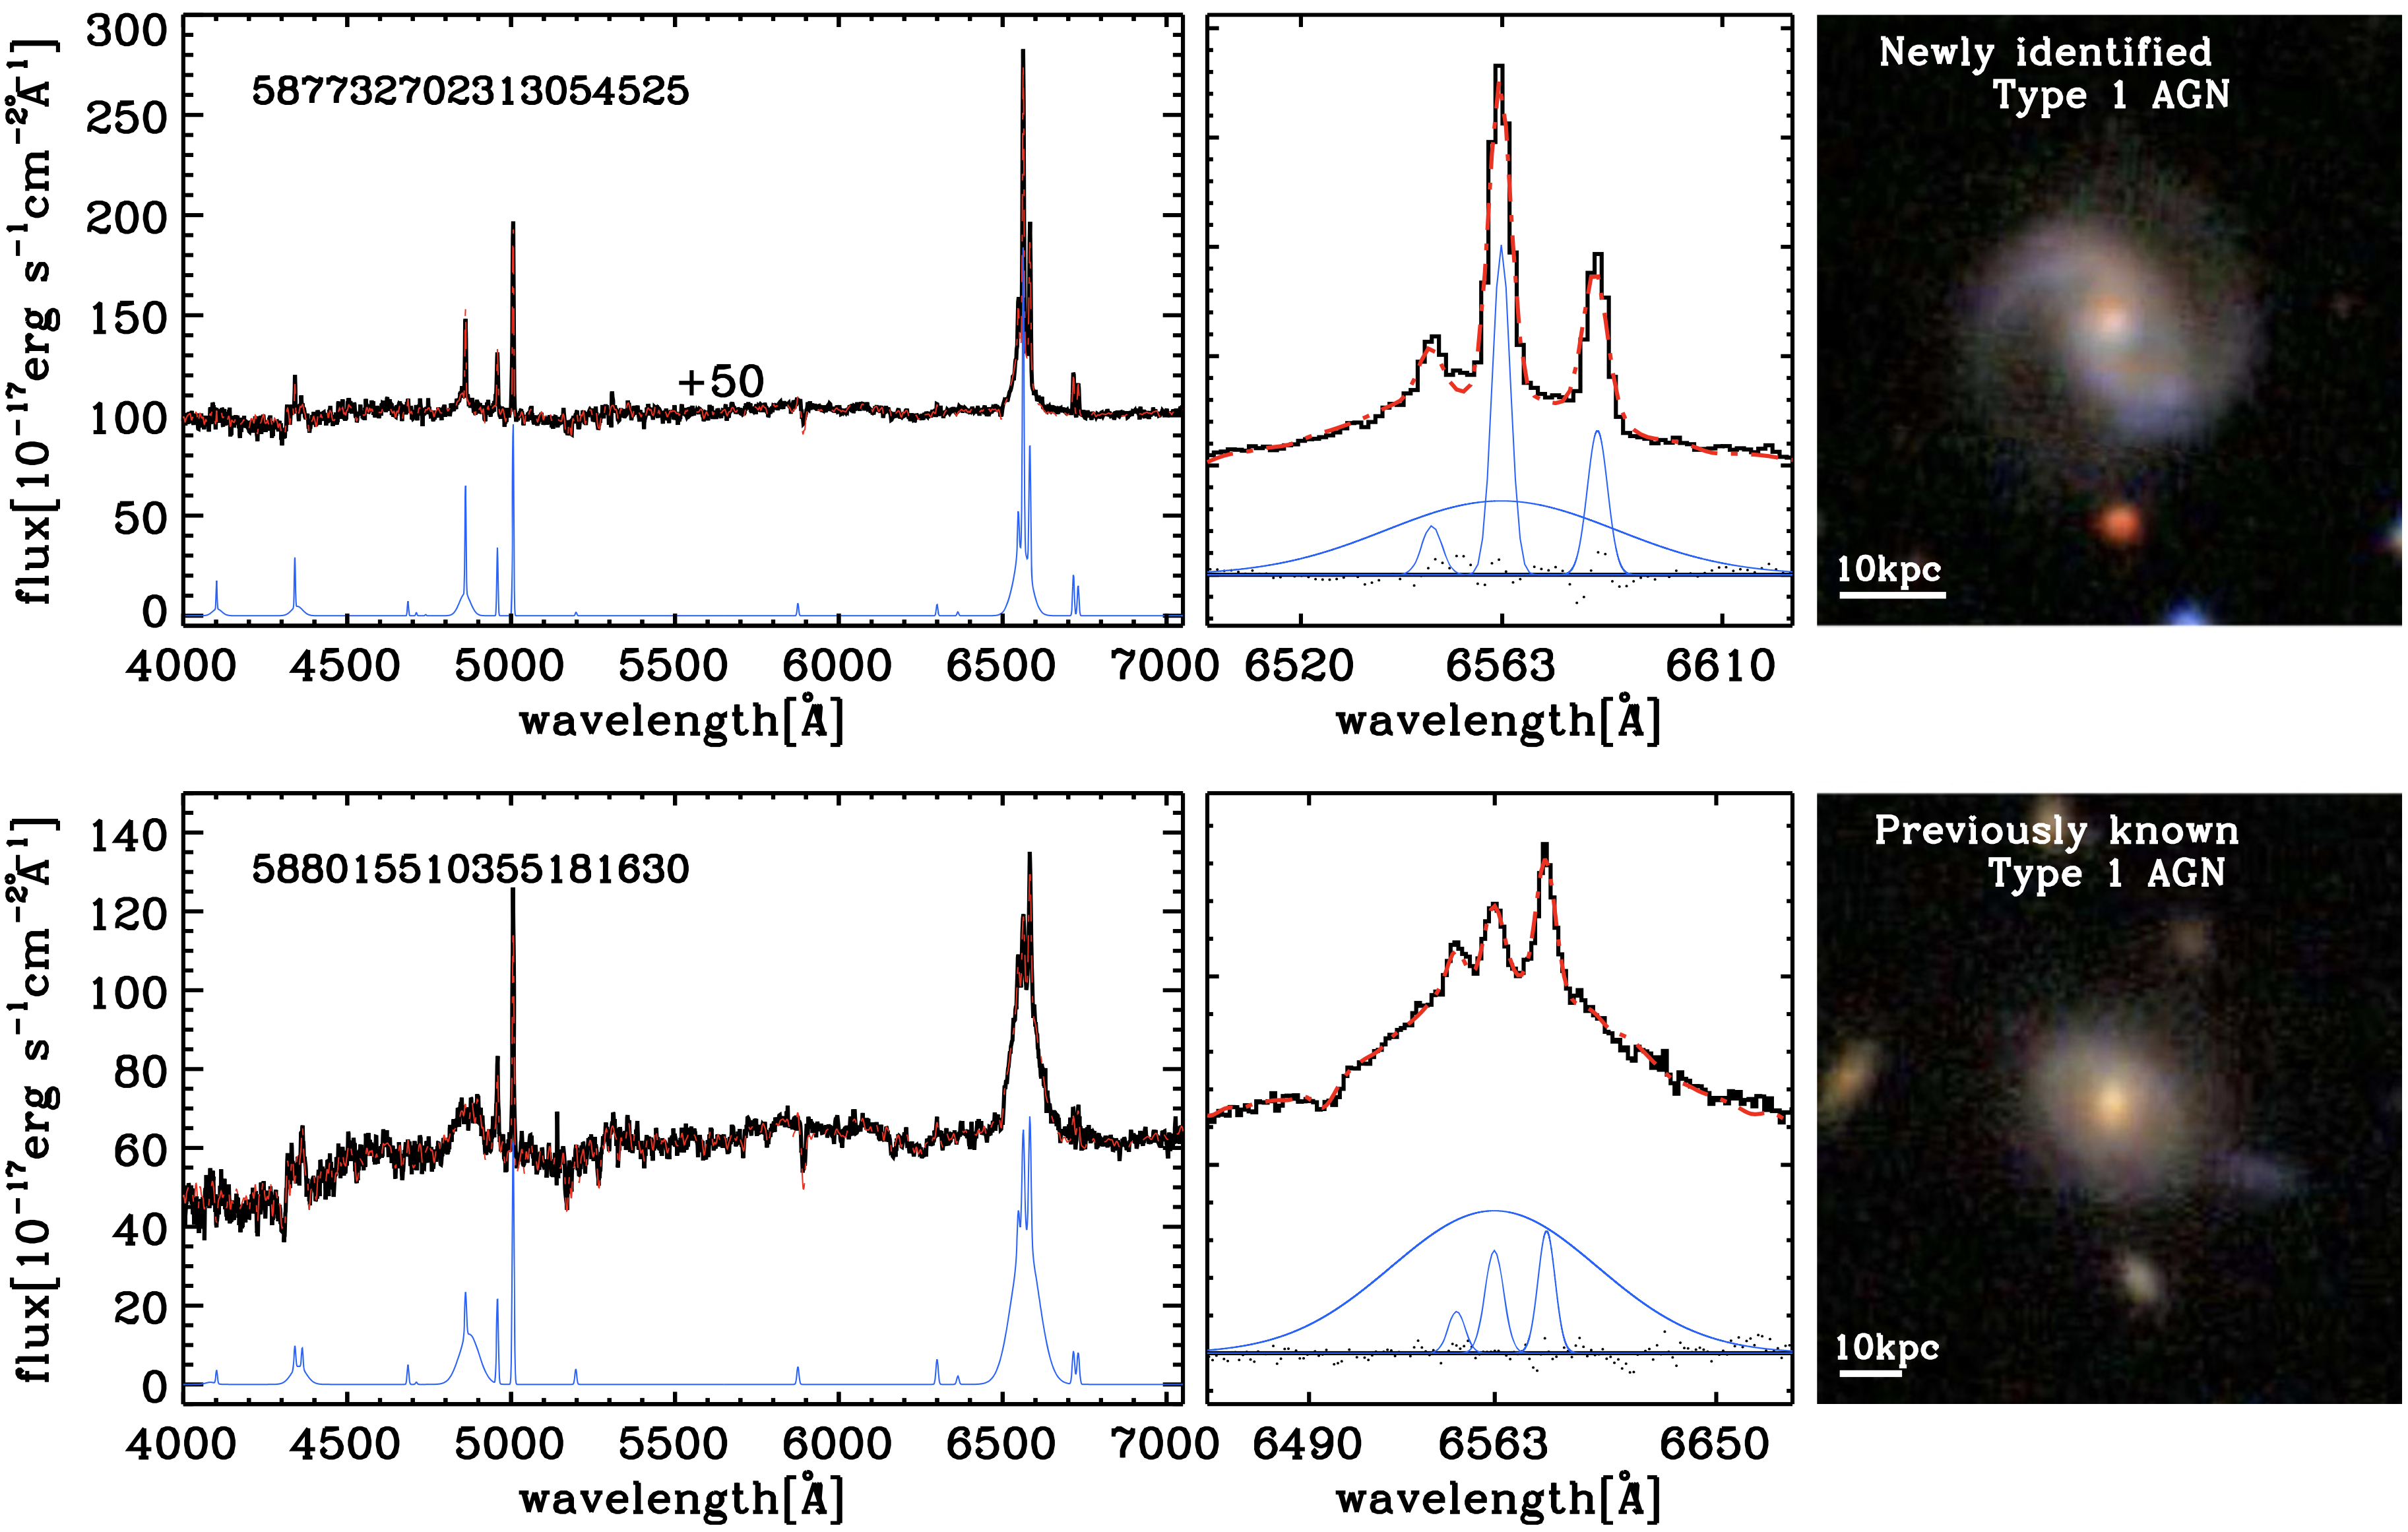
We have identified a substantial number of type 1 active galactic nuclei (AGNs) featuring weak broad-line regions (BLRs) at z < 0.2 from detailed analysis of galaxy spectra in the Sloan Digital Sky Survey Data Release 7. These objects predominantly show a stellar continuum but also a broad Hα emission line, indicating the presence of a low-luminosity AGN oriented so that we are viewing the central engine directly without significant obscuration. These accreting black holes have previously eluded detection due to their weak nature. The newly discovered BLR AGNs have increased the number of known type 1 AGNs by 49%. Some of these new BLR AGNs were detected with the Chandra X-ray Observatory, and their X-ray properties confirm that they are indeed type 1 AGNs. Based on our new and more complete catalog of type 1 AGNs, we derived the type 1 fraction of AGNs as a function of [O III] λ5007 emission luminosity and explored the possible dilution effect on obscured AGNs due to star formation. The new type 1 AGN fraction shows much more complex behavior with respect to black hole mass and bolometric luminosity than has been suggested previously by the existing receding torus model. The type 1 AGN fraction is sensitive to both of these factors, and there seems to be a sweet spot (ridge) in the diagram of black hole mass and bolometric luminosity. Furthermore, we present the possibility that the Eddington ratio plays a role in determining opening angles.
As these broad-line region type 1 AGNs hamper appropriate spectral line fitting, a careful treatment (i.e., applying broad-line prescription) is necessary.Users should cross-match the new catalog of type 1 AGNs with their objects before using the (narrow) emission-line strengths of the OSSY database.
The precise measurements of the (narrow and/or broad) emission-line strengths for these type 1 AGNs (e.g., Hαnr, Hαbr, etc.) can be btained upon request (e-mail: oh at kasi.re.kr).