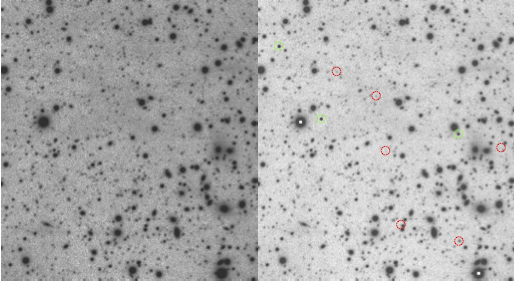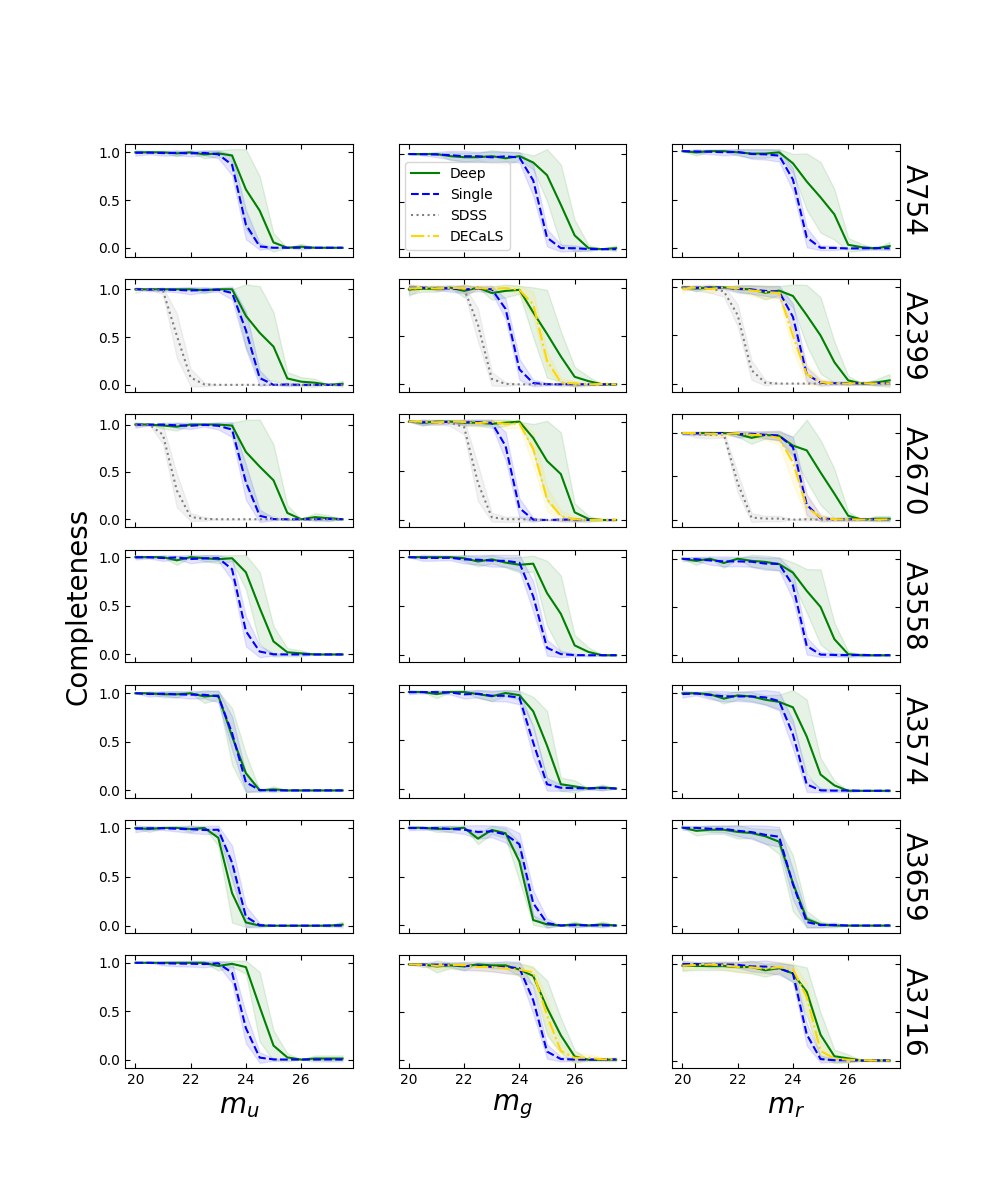
In Section 2.1 of Kim et al. (in prep), we explained how we evaluated the DECam data that we obtained and used. Here, we present the detailed results of the evaluation. Figure 7 shows the fraction of the mock sources detected by SExtractor as a function of the magnitude for three bands and seven clusters. Table 2 lists magnitudes where the fraction falls below 90% and 1%. As we can see more clearly in Figure 8, mlim,1% of our data 1~2 mag deeper than DECaLS. Table 2 also contains columns of magnitude zero points of the combined images and the surface brightness limits of the r´ band which are over 28 mag/arcsec2 except for A3659.


| Cluster | Filter | a´a | mlim,90%b | mlim,1%c | SB100d | SB1000e | SB2000f | ||||||
|---|---|---|---|---|---|---|---|---|---|---|---|---|---|
| Combined | Single | SDSS | DECaLS | Combined | Single | SDSS | DECaLS | ||||||
| A754 | u´ | 4.21 | 23.9 | 23.3 | 25.8 | 24.7 | |||||||
| g´ | 6.38 | 24.5 | 24.1 | 27.3 | 25.5 | ||||||||
| r´ | 6.61 | 24.2 | 23.6 | 26.8 | 25.1 | 28.7 | 28.3 | 28.1 | |||||
| A2399 | u´ | 4.25 | 24.0 | 23.6 | 21.1 | 26.4 | 24.9 | 22.5 | |||||
| g´ | 6.16 | 24.3 | 23.2 | 22.1 | 24.5 | 27.1 | 24.5 | 23.4 | 26.0 | ||||
| r´ | 6.46 | 24.2 | 23.6 | 21.6 | 23.5 | 26.9 | 25.1 | 23.0 | 25.0 | 28.7 | 28.0 | 27.8 | |
| A2670 | u´ | 4.06 | 23.8 | 23.5 | 21.0 | 26.4 | 24.8 | 22.4 | |||||
| g´ | 6.18 | 24.6 | 23.2 | 22.0 | 24.2 | 26.9 | 24.6 | 23.8 | 25.8 | ||||
| r´ | 6.28 | 24.2 | 23.7 | 21.5 | 23.6 | 27.1 | 25.4 | 22.9 | 25.4 | 28.8 | 28.7 | 28.3 | |
| A3558 | u´ | 4.23 | 24.0 | 23.5 | 26.1 | 24.8 | |||||||
| g´ | 6.37 | 24.7 | 24.1 | 26.5 | 25.5 | ||||||||
| r´ | 6.60 | 24.1 | 23.5 | 27.3 | 25.1 | 28.8 | 28.3 | 27.9 | |||||
| A3574 | u´ | 4.19 | 23.2 | 23.1 | 24.8 | 24.5 | |||||||
| g´ | 6.41 | 24.5 | 24.0 | 26.4 | 25.6 | ||||||||
| r´ | 6.60 | 23.9 | 23.5 | 25.9 | 25.0 | 28.2 | 27.9 | 27.6 | |||||
| A3659 | u´ | 4.22 | 23.1 | 23.1 | 24.8 | 24.5 | |||||||
| g´ | 6.15 | 23.9 | 23.7 | 25.4 | 25.0 | ||||||||
| r´ | 6.41 | 23.3 | 23.5 | 25.3 | 24.8 | 27.5 | 27.1 | 27.0 | |||||
| A3716 | u´ | 4.01 | 24.1 | 23.5 | 25.9 | 24.8 | |||||||
| g´ | 6.26 | 24.6 | 24.1 | 24.5 | 26.8 | 25.8 | 26.2 | ||||||
| r´ | 6.43 | 24.0 | 23.8 | 23.9 | 26.6 | 25.3 | 25.6 | 28.2 | 28.0 | 27.2 | |||
| Note: (a) Magnitude zero points offsets (from 25) of the combined images, (b) Completeness magnitudes where 90% of mock sources are recovered by SExtractor detection, (c) Completeness magnitudes where 1% of mock sources are recovered by SExtractor detection, (d) Surface brightness limit, the median of standard deviation in moving mesh box 100x100 pixels [mag/ arcsec2], (e) Same as (d) with box size of 1000x1000 pixels, (f) Same as (d) with box size of 2000x2000 pixels | |||||||||||||

For more information please refer to Kim et al. (in prep), or
Send an email to duhokim81@gmail.com