
Can this work predict the spectral features of Seyferts & LINERs?
Predicting emission-line ratios using all types of data
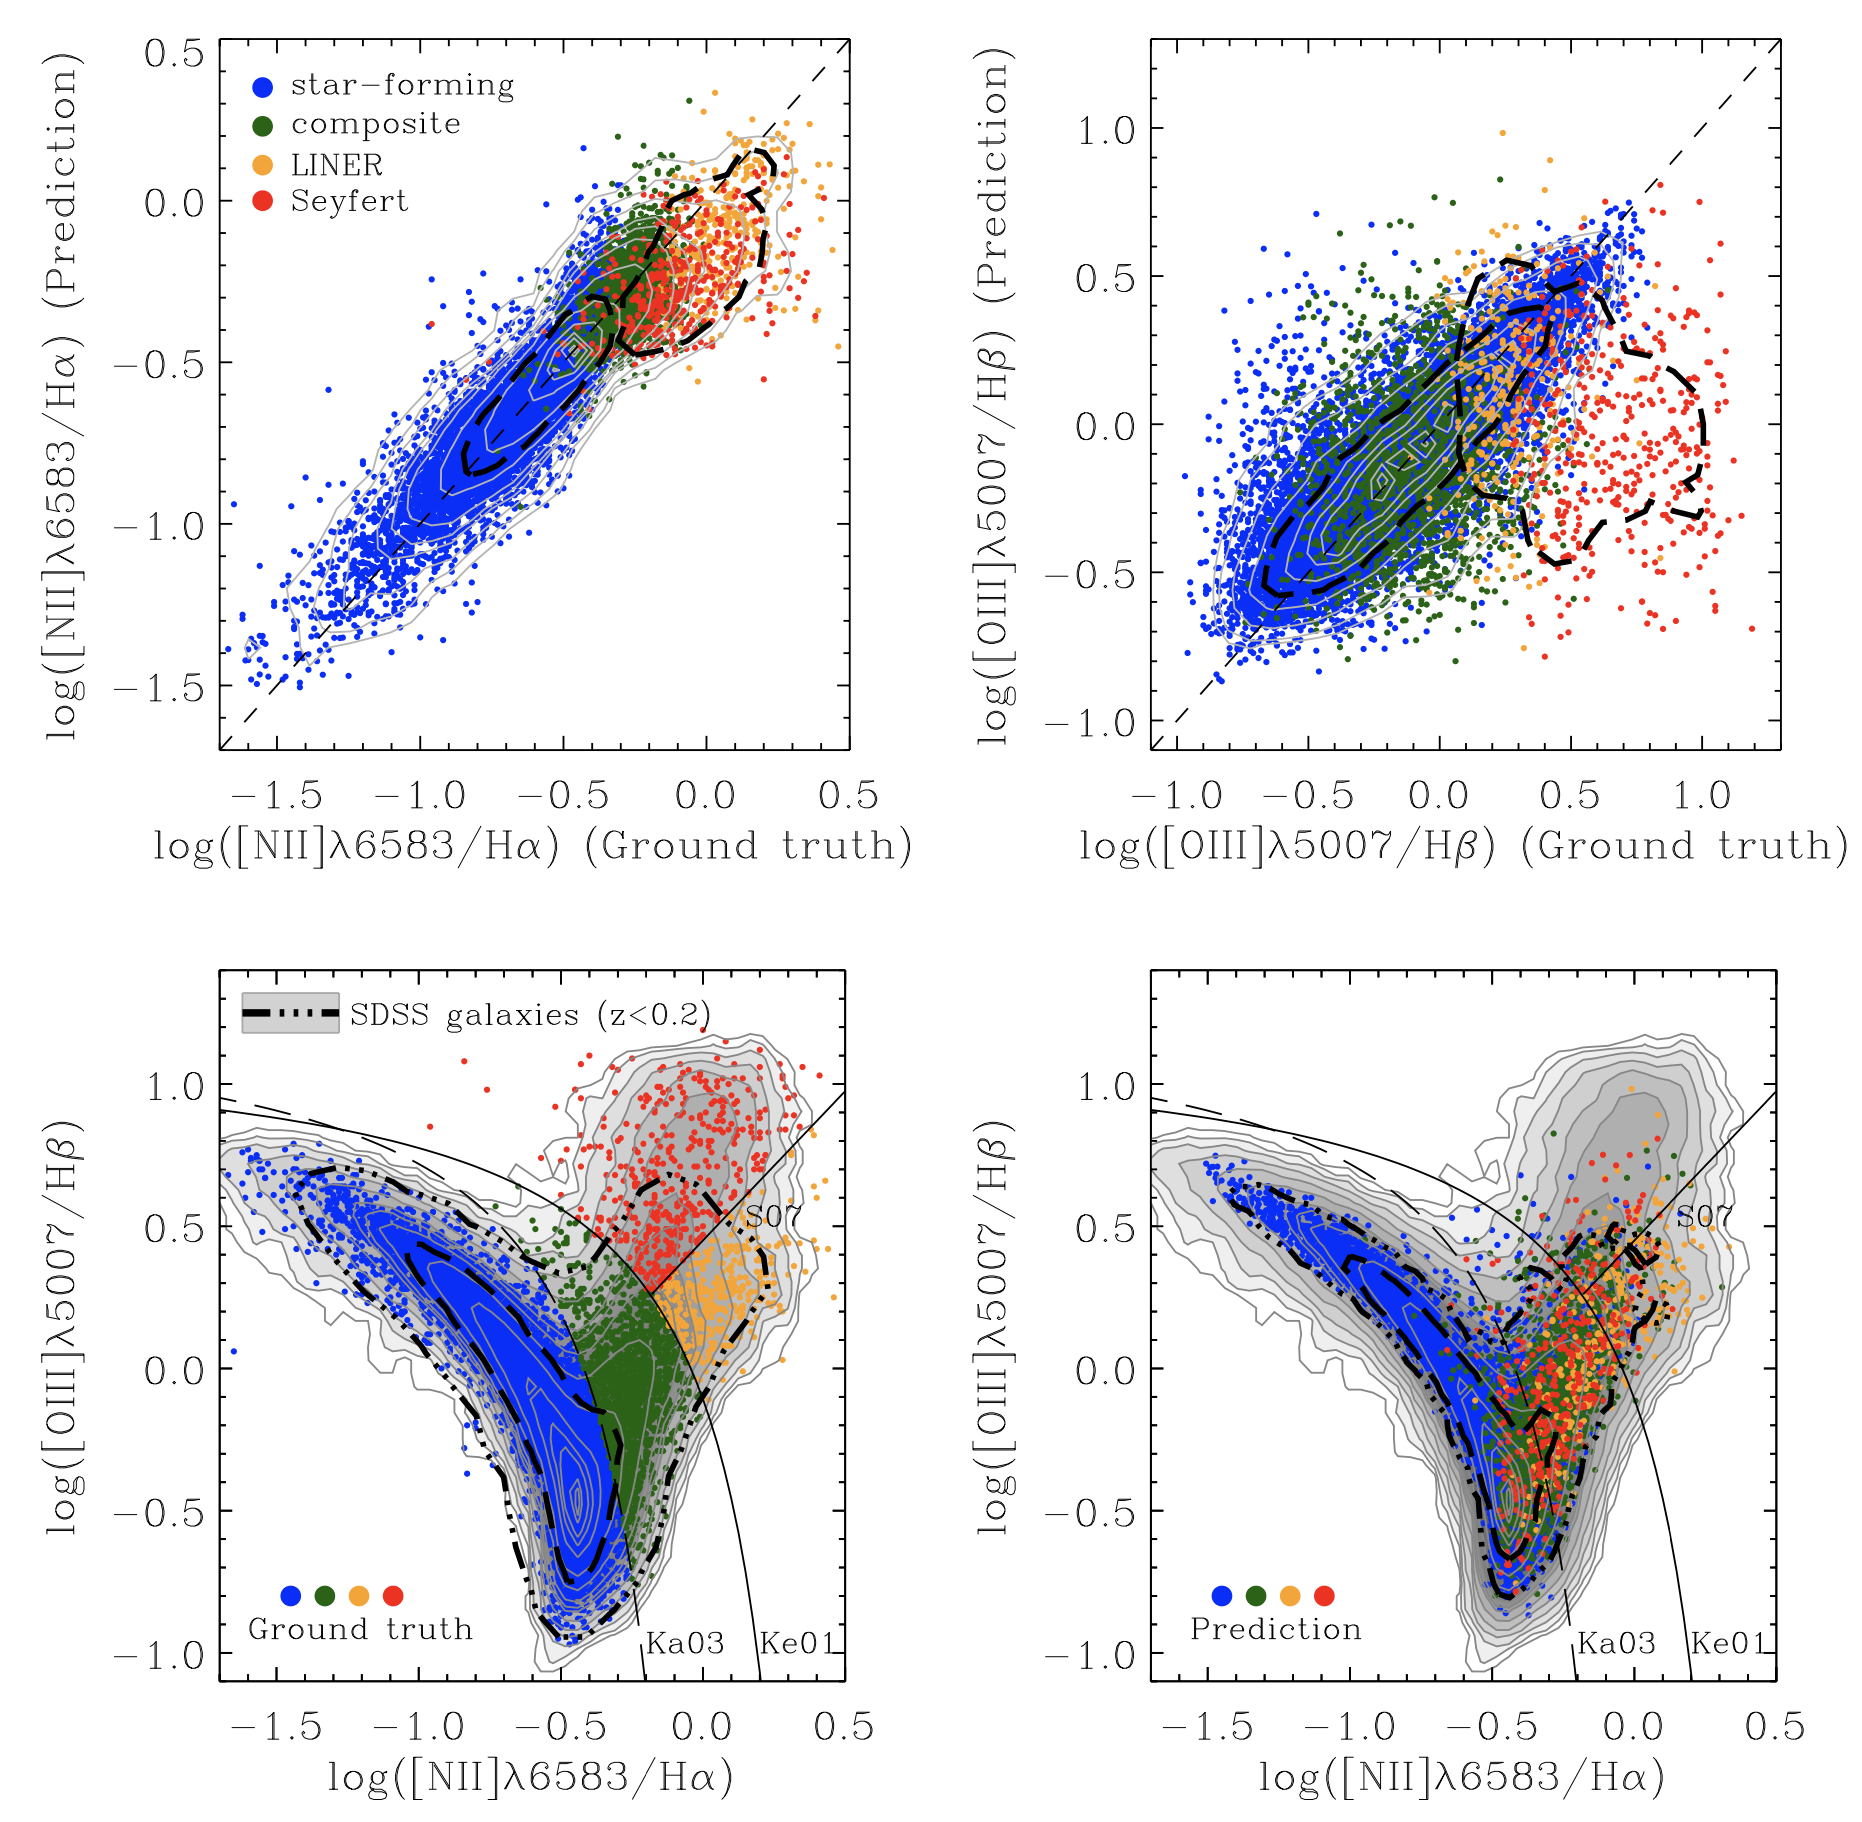
This figure illustrates the [NII]λ6583/Hα and [OIII]λ5007/Hβ
emission-line ratios (upper panels) and their combined results in the BPT diagram
(lower panels).
The figure includes not only star-forming galaxies (blue-filled dots)
but also other types of galaxies,
such as composite (green-filled dots),
LINERs (orange-filled dots), and Seyferts (red-filled dots).
Since star-forming features are well extracted from the galaxy JPEG images,
the predictions work for both star-forming and composite galaxies,
which exhibit embedded star-forming features in the images.
However, feature extraction for LINERs and Seyferts
– where nuclear emissions play a key role in their classification in the BPT diagram –
is less effective due to the limited pixel coverage of the nucleus
relative to the entire galaxy in the image.
This lack of information biases the predictions toward
the average values of [NII]λ6583/Hα and [OIII]λ5007/Hβ,
leading to spurious and unphysical results in the BPT diagram.