
We present a novel approach for classifying star-forming galaxies using photometric images.
(full paper)
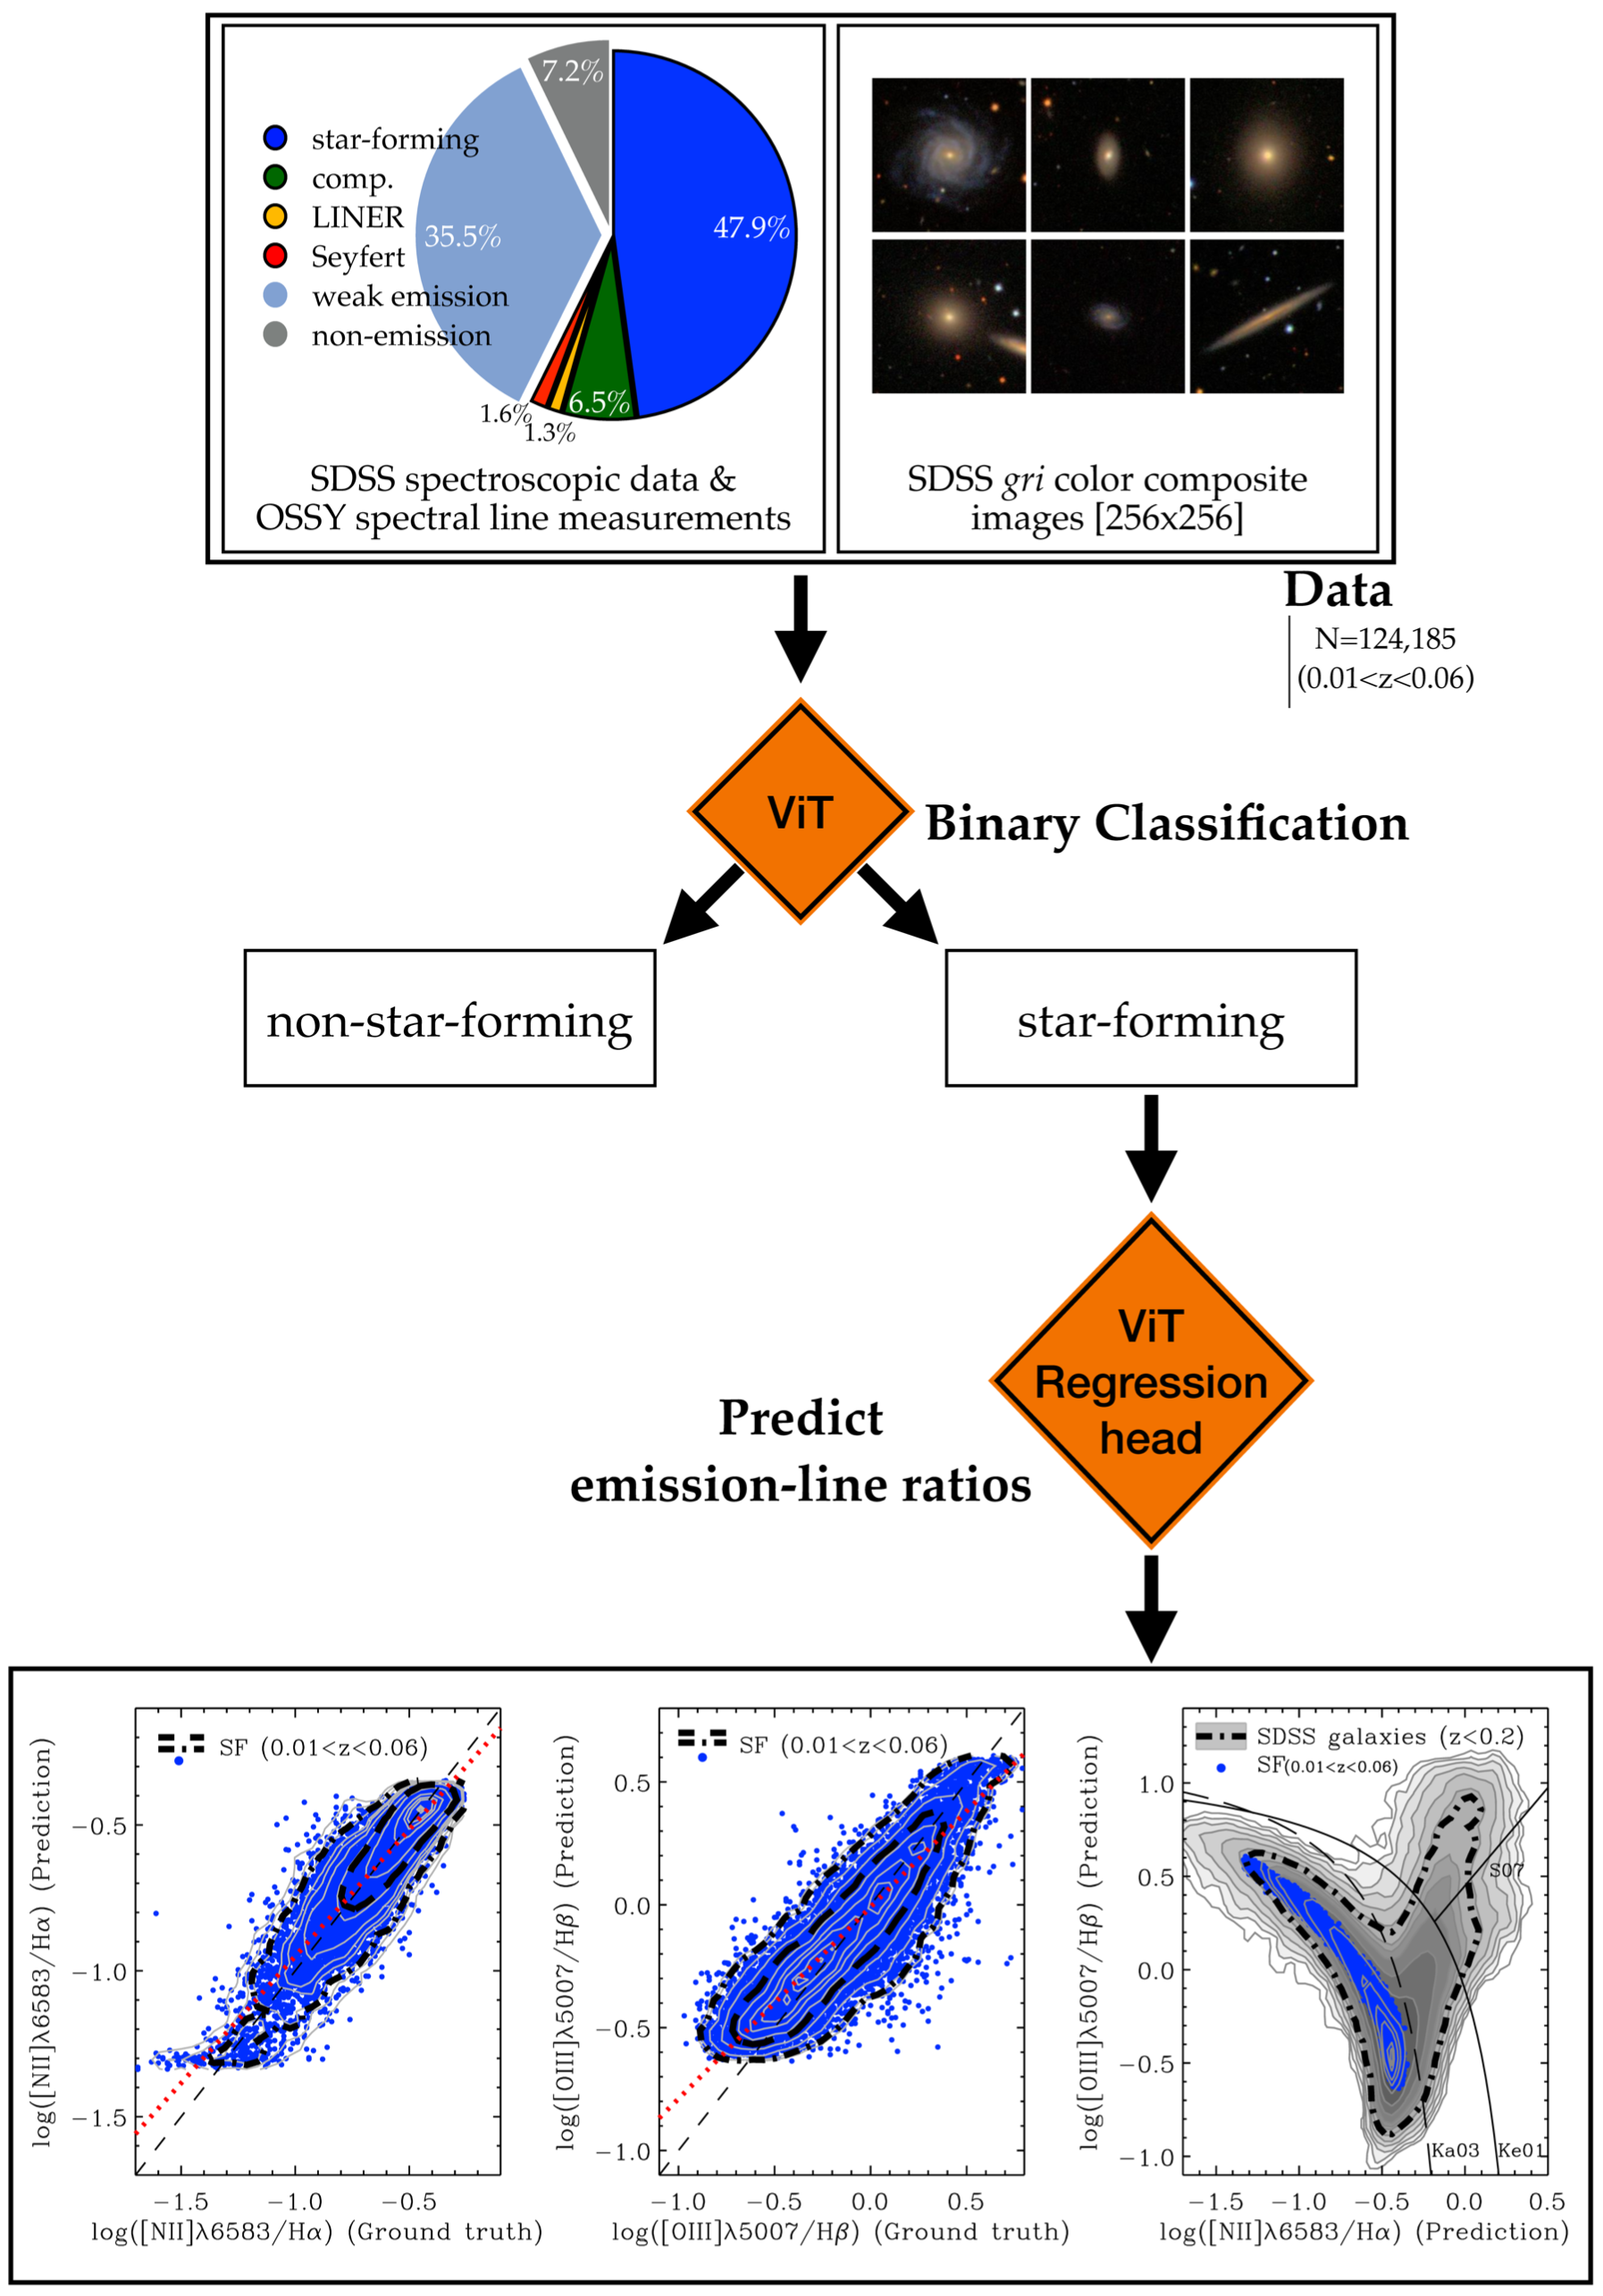
SDSS optical color composite images
By utilizing approximately 124,000 optical color composite images and spectroscopic data of nearby galaxies at 0.01 < z < 0.06 from the Sloan Digital Sky Survey, along with follow-up spectroscopic line measurements from the OSSY catalog, and leveraging the Vision Transformer machine-learning technique, we demonstrate that galaxy images in JPG format alone can be directly used to determine whether star-forming activity dominates the galaxy, bypassing traditional spectroscopic analyses such as emission-line diagnostic diagrams.
Vision Transformer Base Architecture
Our approach employs a Vision Transformer (ViT) architecture to analyze galaxy images for two distinct tasks: the classification of galaxies into star-forming and non-star-forming categories, and the prediction of emission line ratios.
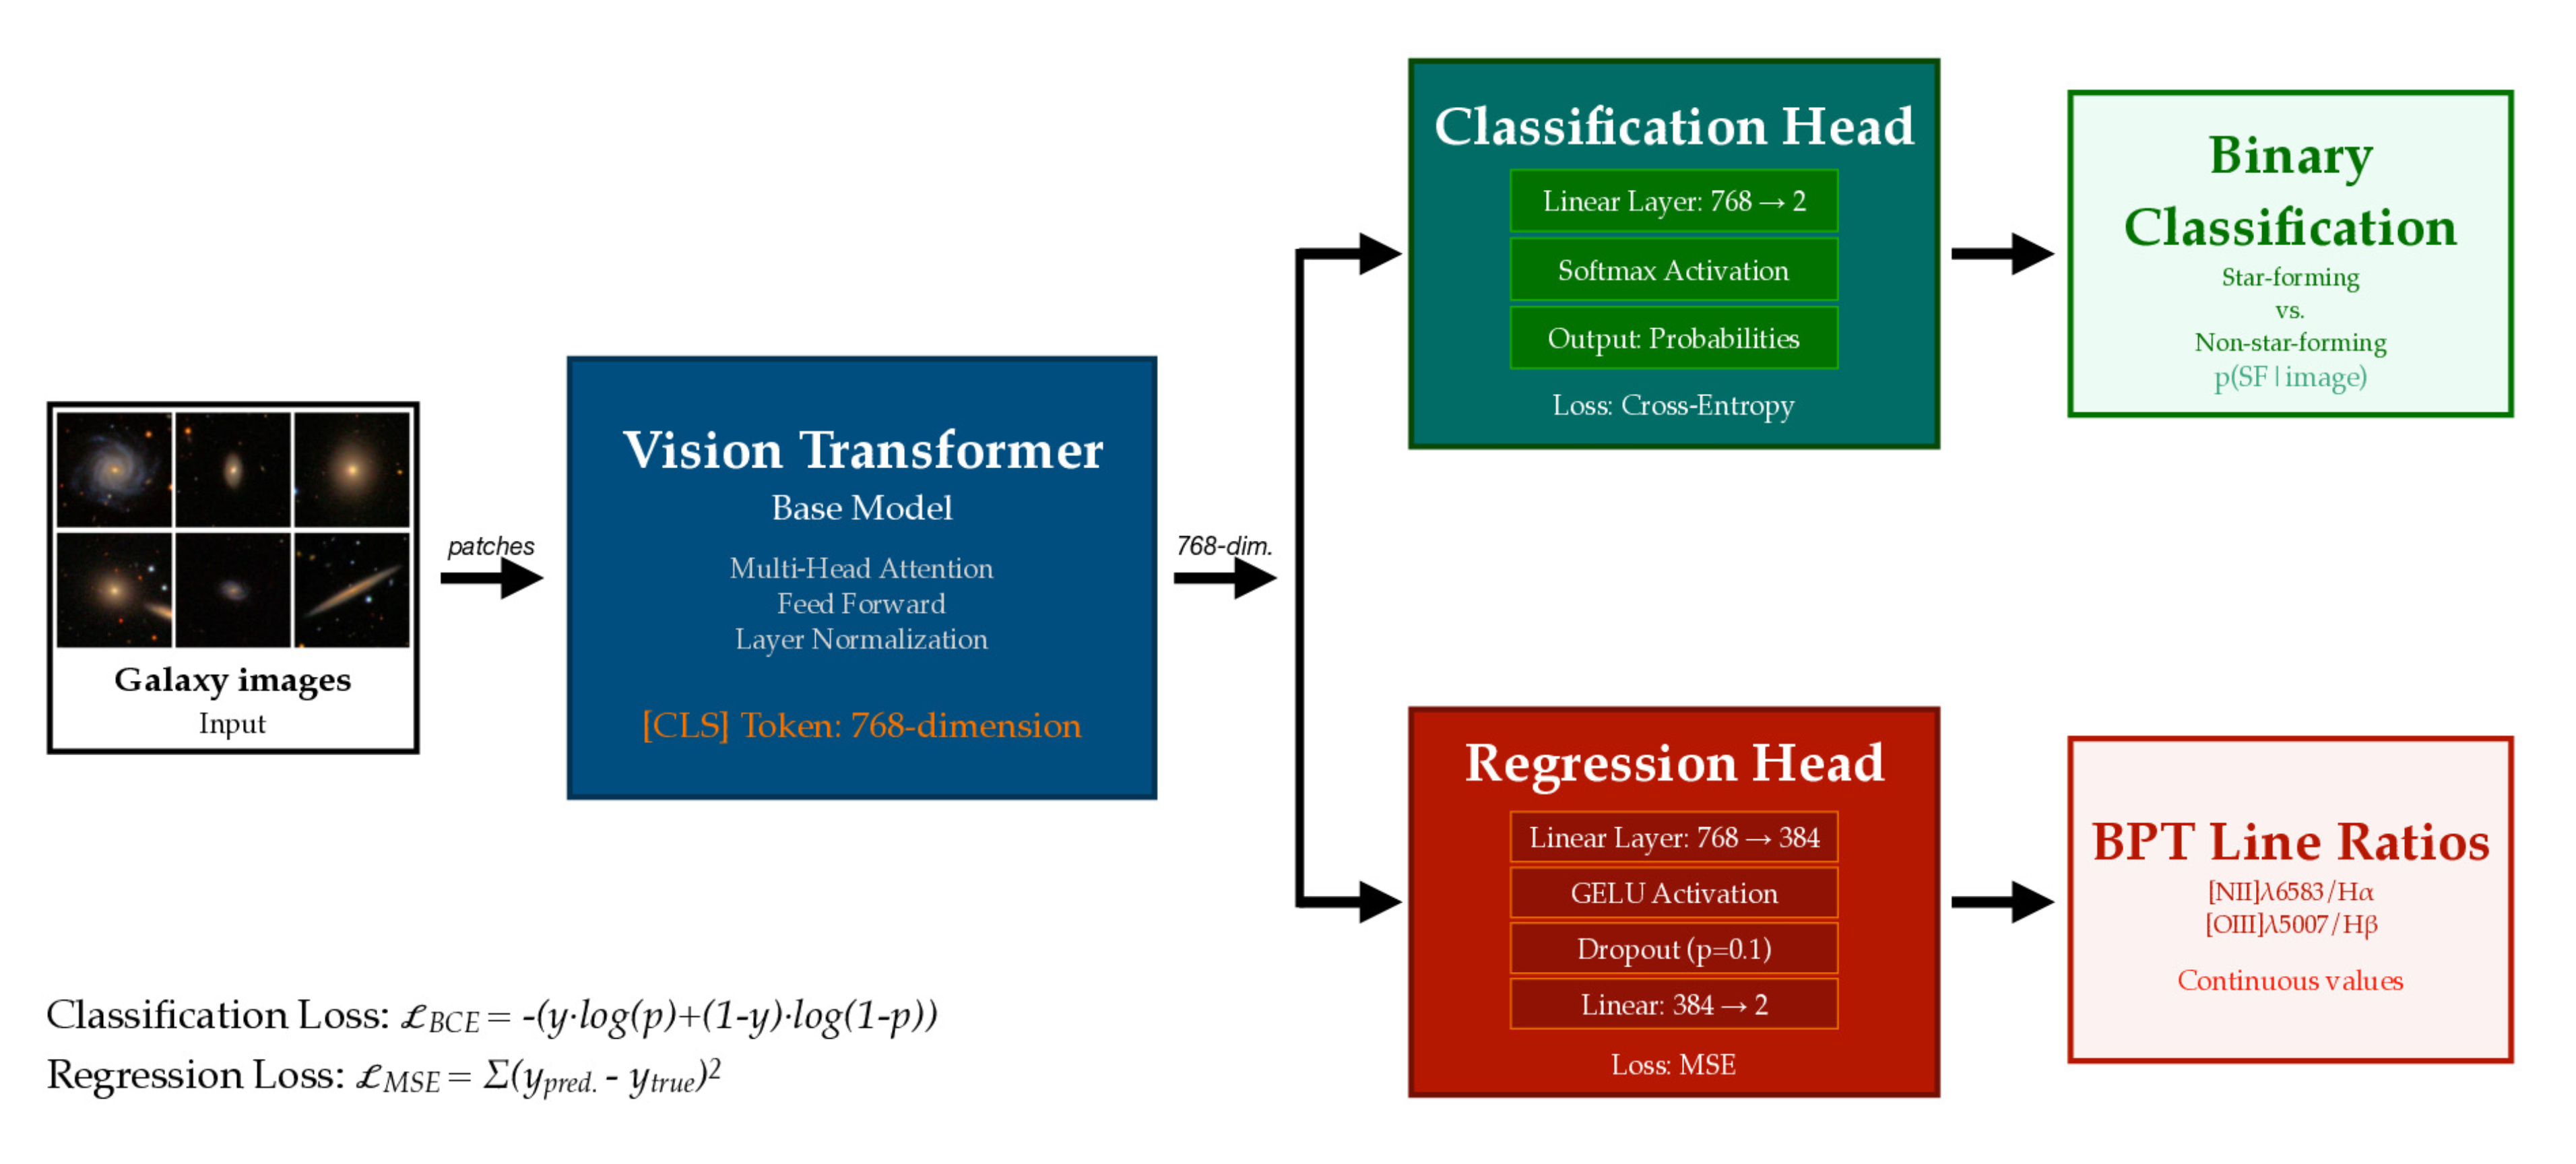
ViT Architecture for galaxy classification and regression
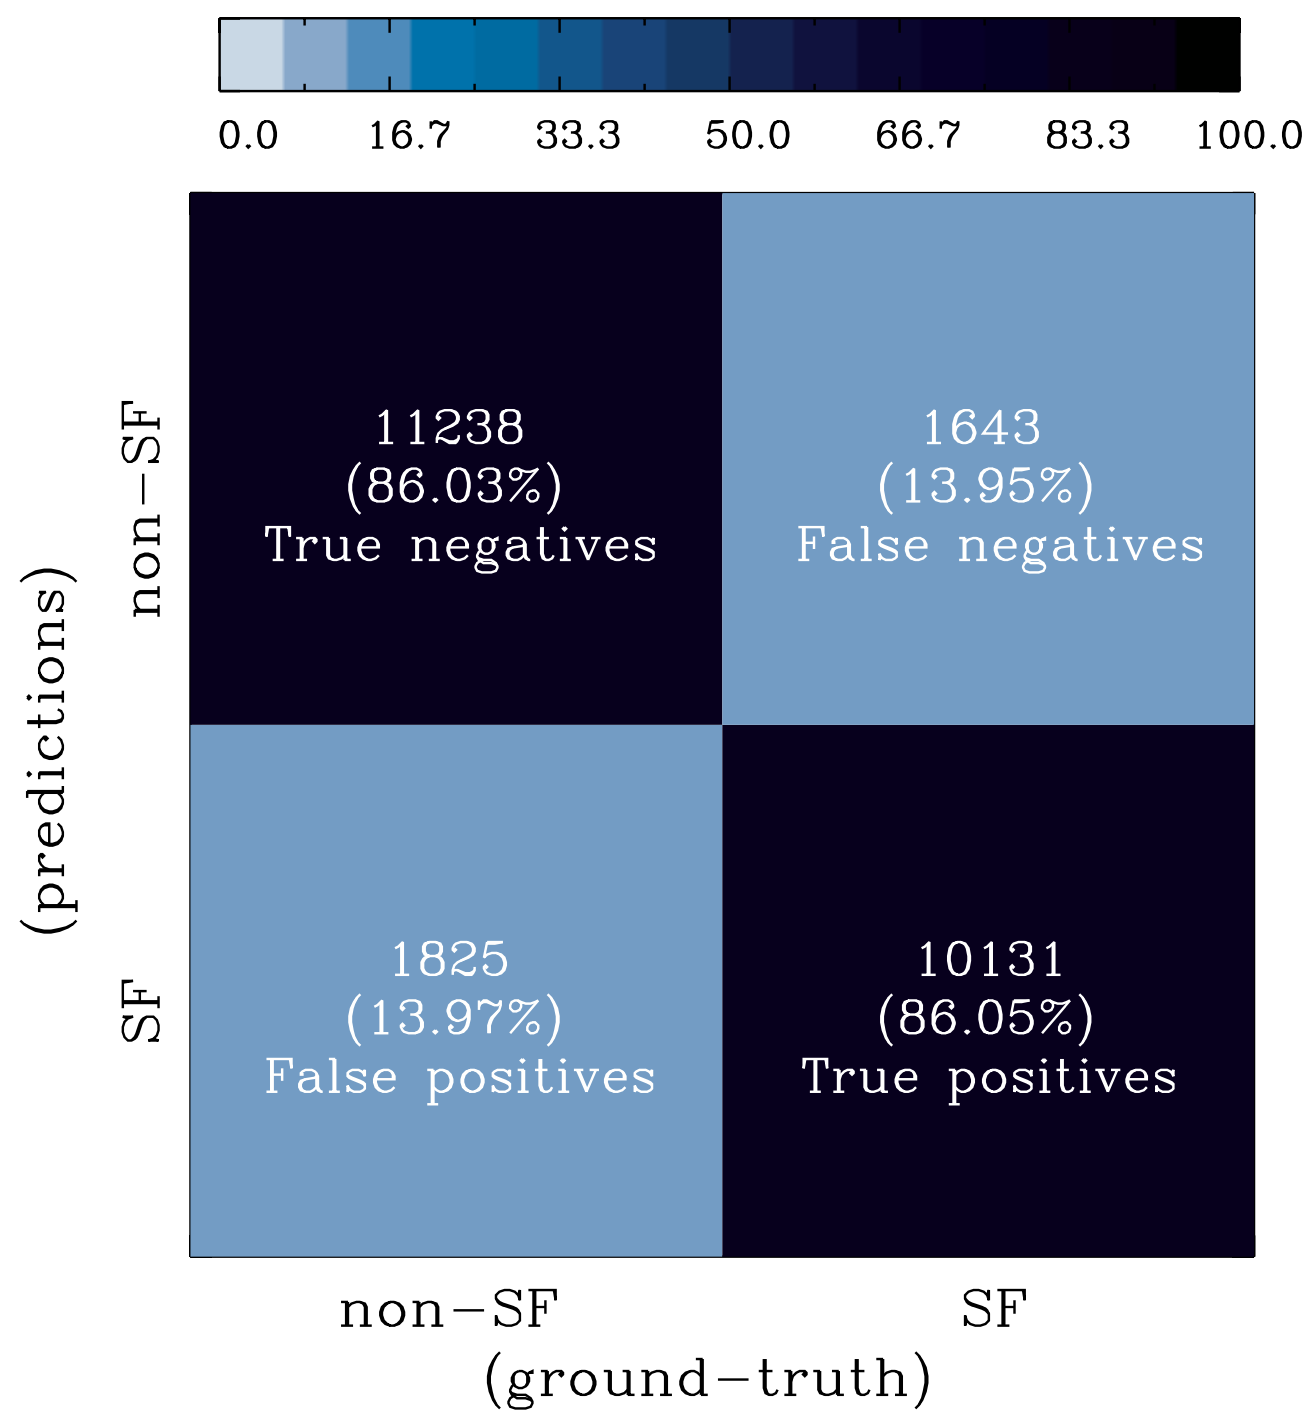
Star-Formation Classification
For classifying galaxies into star-forming and non-star-forming categories, we implement a classification approach that operates on the 768-dimensional [CLS] token representation from the vision transformer. The classification mechanism consists of a linear transformation that projects this representation to two output logits, corresponding to the two classes. The model is trained using cross-entropy loss, and during inference, a softmax function transforms these logits into class probabilities, where the probability for the star-forming class indicates the model’s confidence in the galaxy being star-forming.
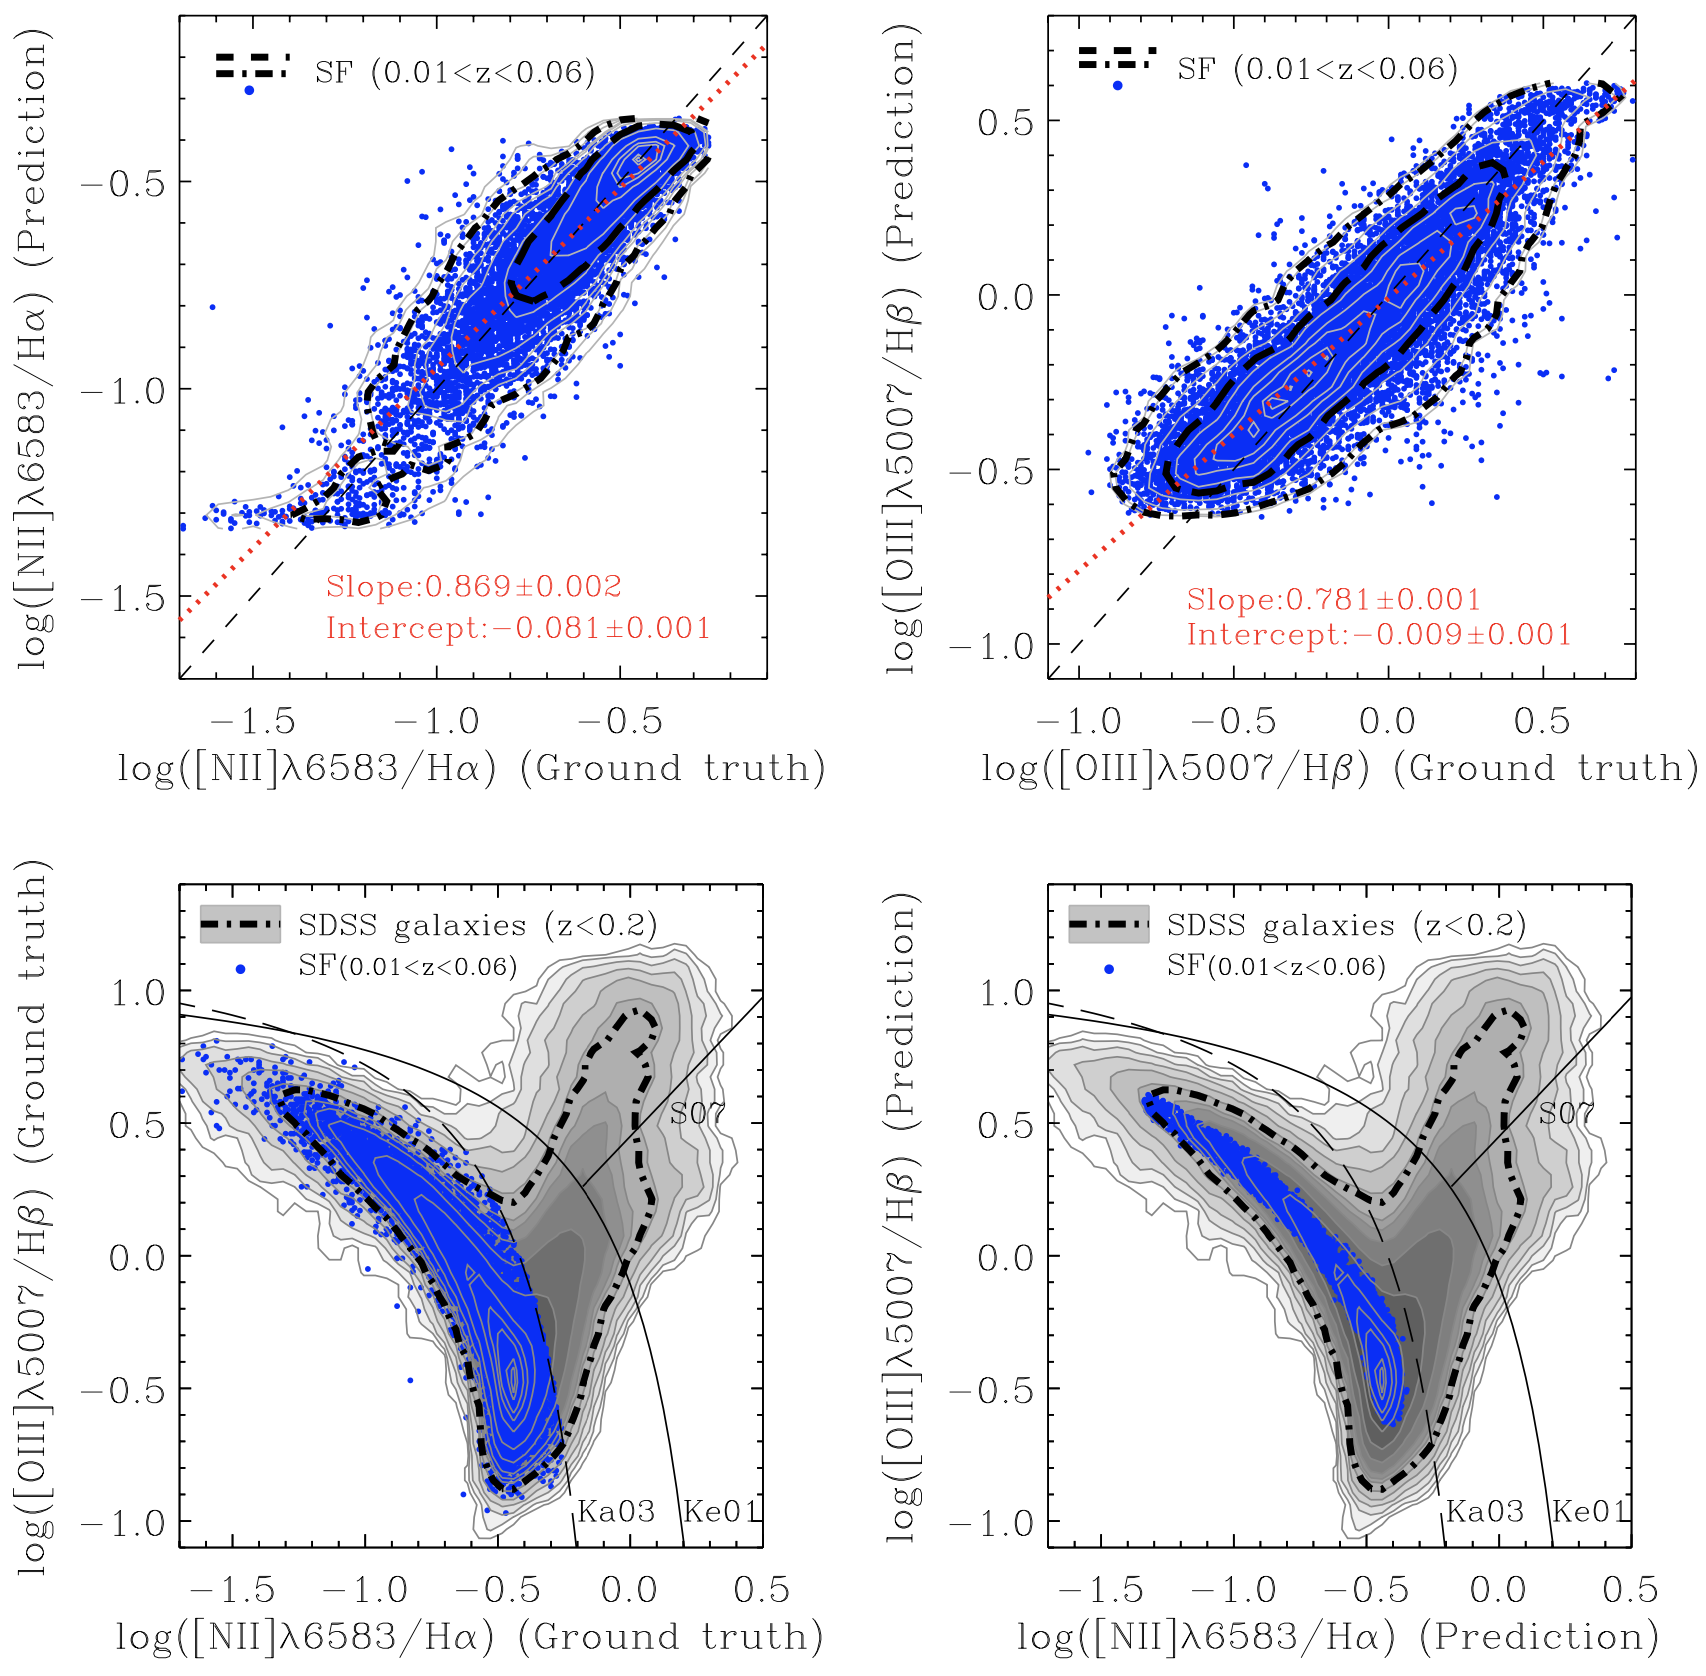
Emission-Line Ratios
The regression variant, designed to predict BPT diagnostic line ratios ([NII]λ6583/Hα and [OIII]λ5007/Hβ), maintains the same base model but is modified for continuous output values. The regression head processes the [CLS] token through an initial dimensionality reduction from 768 to 384 features, followed by GELU activation. A dropout layer (p = 0.1) is employed for regularization. The final linear layer outputs two values, corresponding to the two line ratios. This architecture maintains sufficient complexity to capture the relationship between visual features and spectroscopic properties while preventing overfitting through dimensional reduction and dropout regularization.
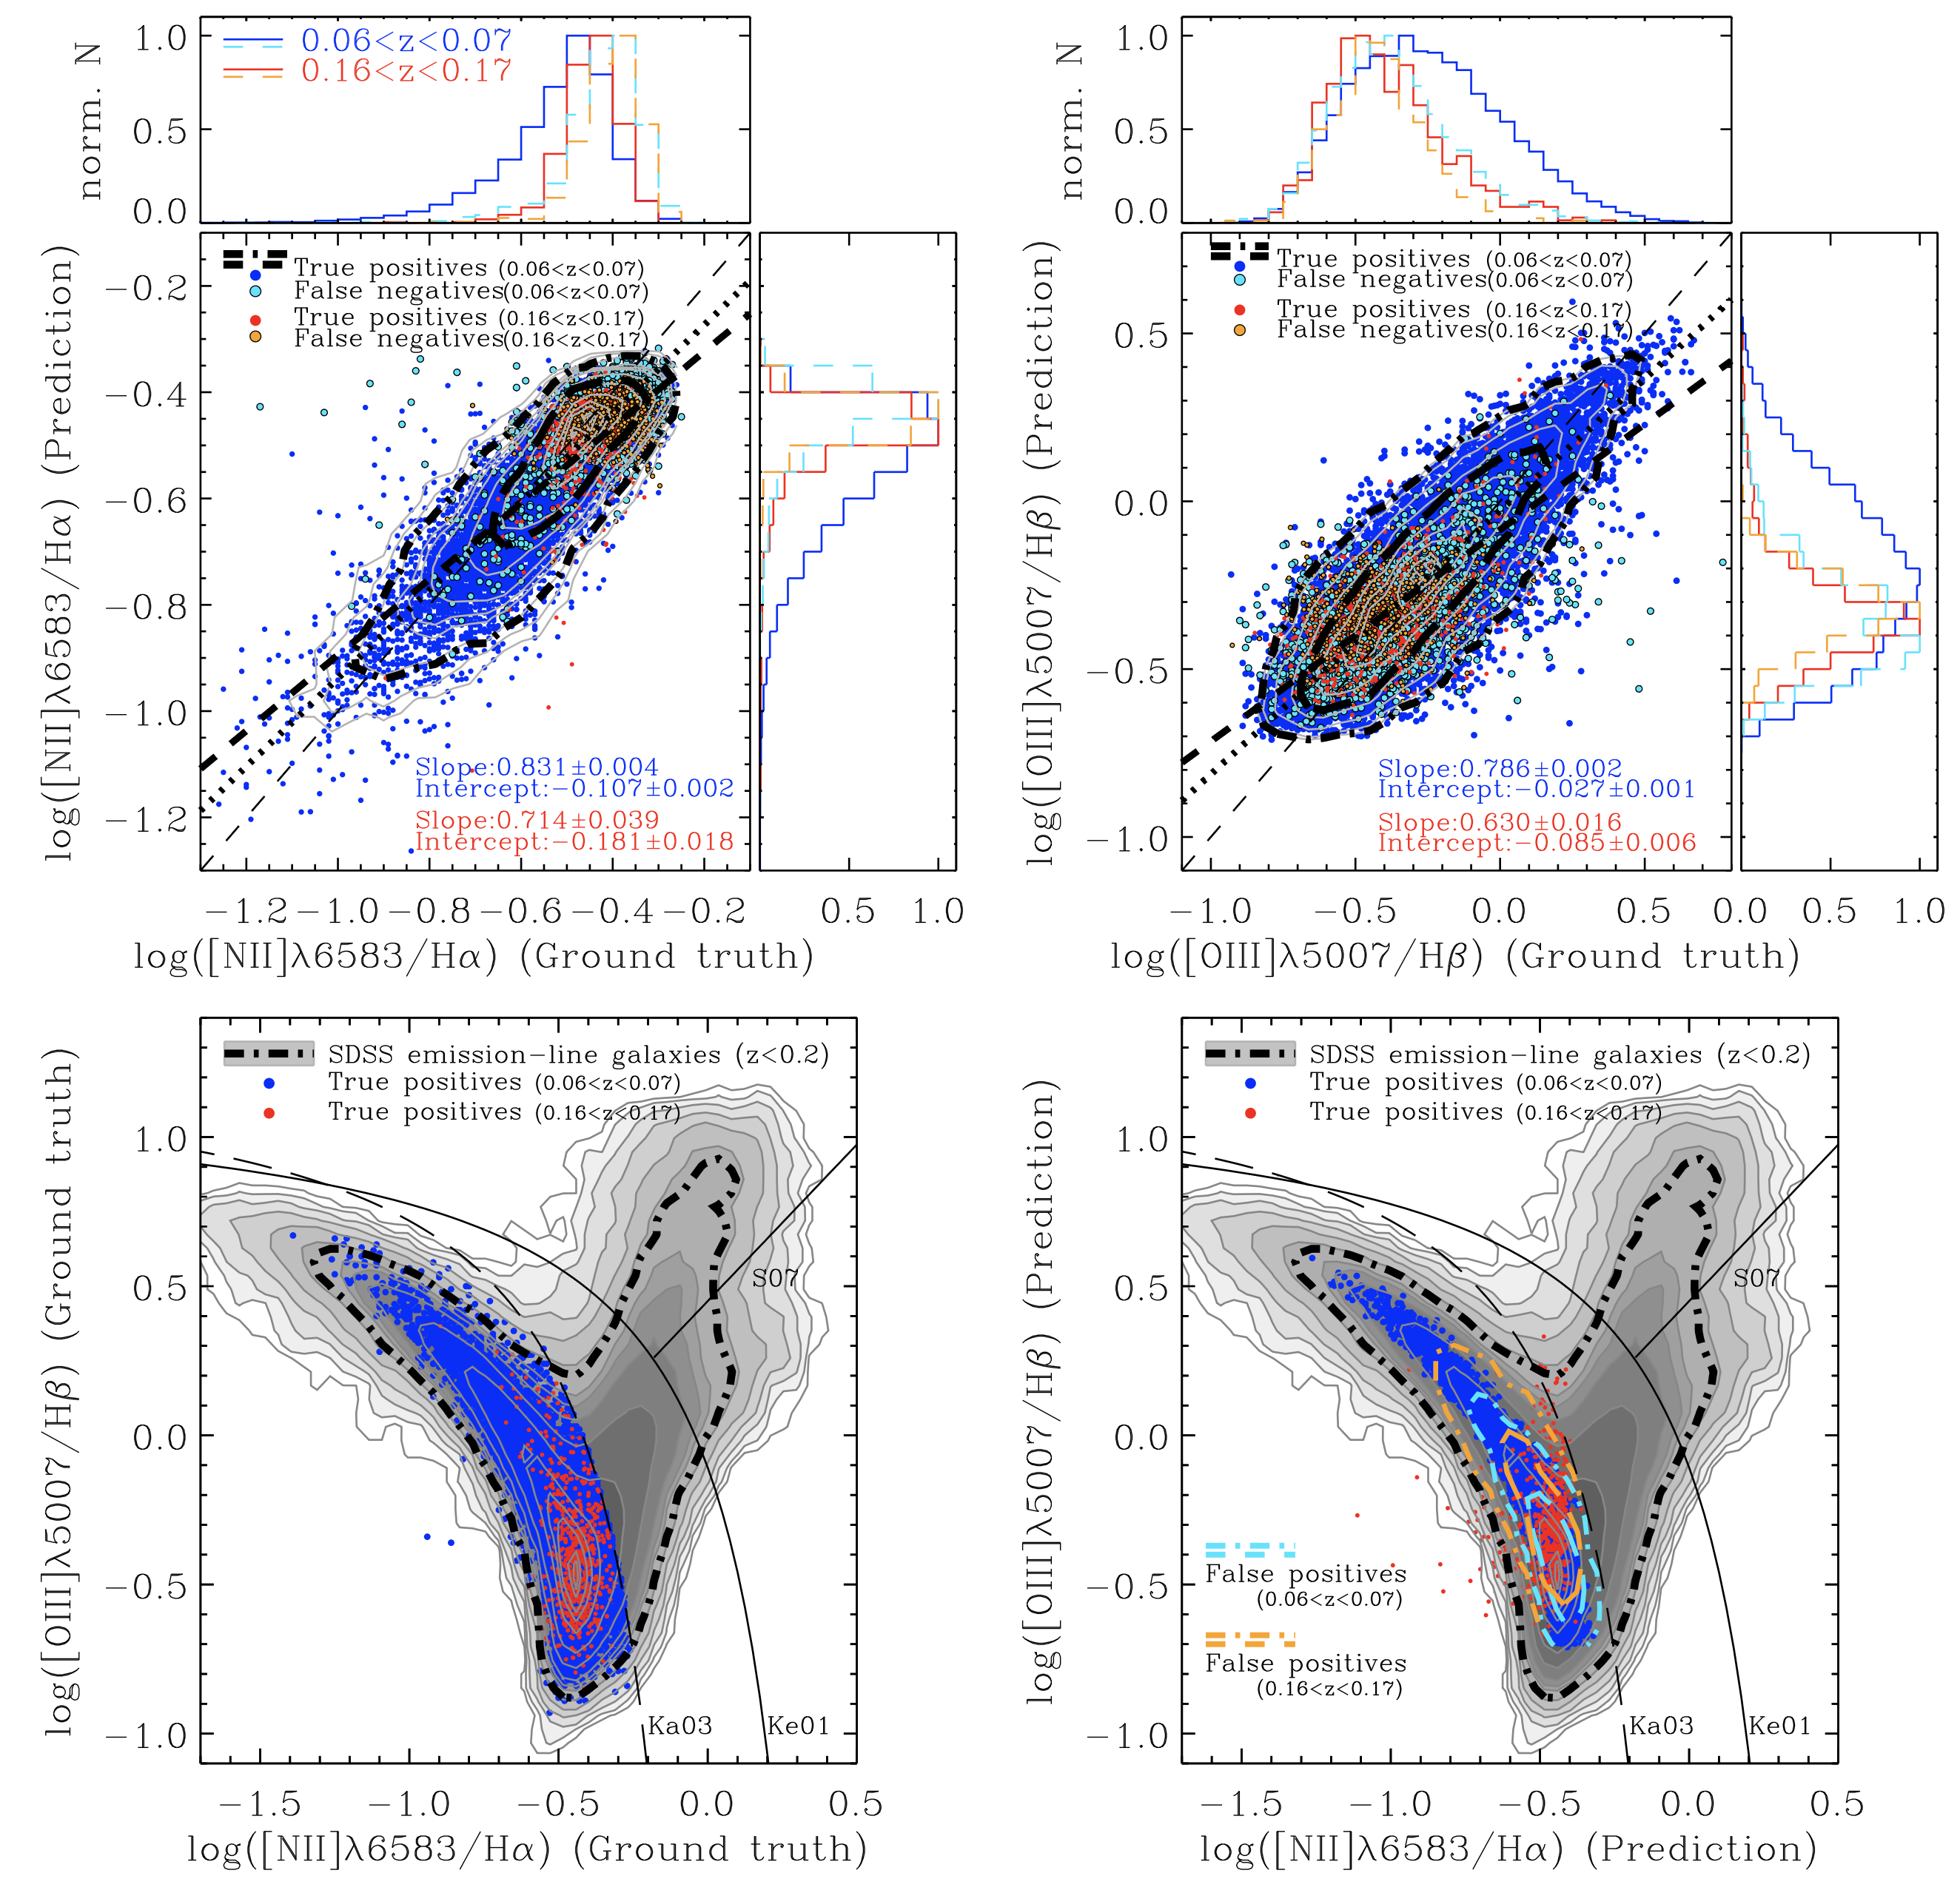
Performance Validation on Unseen Redshift Ranges
To evaluate our model's ability to generalize beyond its training distribution,
we tested our ViT architecture on an extrapolation dataset containing galaxies
with redshifts outside the training range.
While our model was trained on galaxies within the redshift range of 0.01-0.06,
this evaluation dataset consists of galaxies with two redshifts bins at 0.06<z<0.07 (N = 45,402)
and 0.16<z<0.17 (N = 23,026), where the SDSS and the OSSY database provide enough number of
galaxy photometric images and spectroscopic data.
This experimental design allows us to assess whether the learned features
remain valid when applied to a data set that has never been exposed to the model.