We explain how people can use our analysis in various cases. The main
explanation of our analysis can be found in the following papers:
Detecting variability in massive astronomical time series data - I. Application of an infinite Gaussian mixture model : Shin et al., 2009, MNRAS, 400, 1897
Detecting variability in massive astronomical time series data - II. Variable Candidates in the Northern Sky Variability Survey : Shin et al., 2012, AJ, 143, 65
1. Finding variable candidates in the NSVS field 016a without other constraints of positions.
You can select variable candidates by searching objects which are not included in large clusters and/or which
have D_Ms larger than D_M cut. In this example, we find variable candidates by looking for objects that are not
included in the largest cluster in the field and that have D_M larger than D_M 99% cut.
(Step 1) Find the clustering results of the field 016a in the "Field information" page. In the field
016a, the D_M 99% cut is 5.200767. The largest cluster's id is 5.
(Step 2) Download the object list file of the field 016a in the "Download" page.
(Step 3) Use awk or other tools to extract rows of the NSVS objects which do not have the cluster id 5, and
which have D_M larger than 5.200767.
2. Finding variable candidates in the NSVS field 016a with other constraints of positions.
In this example, we search variable candidate in the field 016a with some search coordinate and radius.
(Step 1) Find the clustering results of the field 016a in the "Field information" page. In the field
016a, the D_M 99% cut is 5.200767. The largest cluster's id is 5.
(Step 2) Use "General search for interactive usage" with your coordinate and search radius as well as
the minimum D_M 5.200767. Save the results into a file by clicking the option box.
(Step 3) Use awk or other tools to extract rows of the NSVS objects which do not have the cluster id 5.
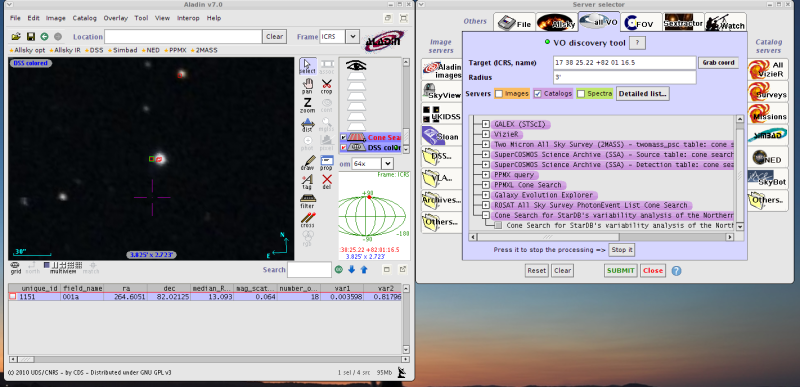
3. Finding variable candidates in the NSVS field by using Aladin.
The simple cone search service provided for the NSVS analysis can be accessed by using Aladin.
(Step 1) Open/run Aladin window.
(Step 2) Type coordinates or use your data to extract coordinates information.
(Step 3) Choose "File > Load from the Virtual Observatory".
(Step 4) Make sure that you select "Catalogs", and then type a search radius. In the current configuration, the
maximum search radius is 3 arcmin in our simple cone search.
As explained in the method 1, use the D_M and clustering results of the fields to examine strengths of variability for
the objects retrieved by Aladin.
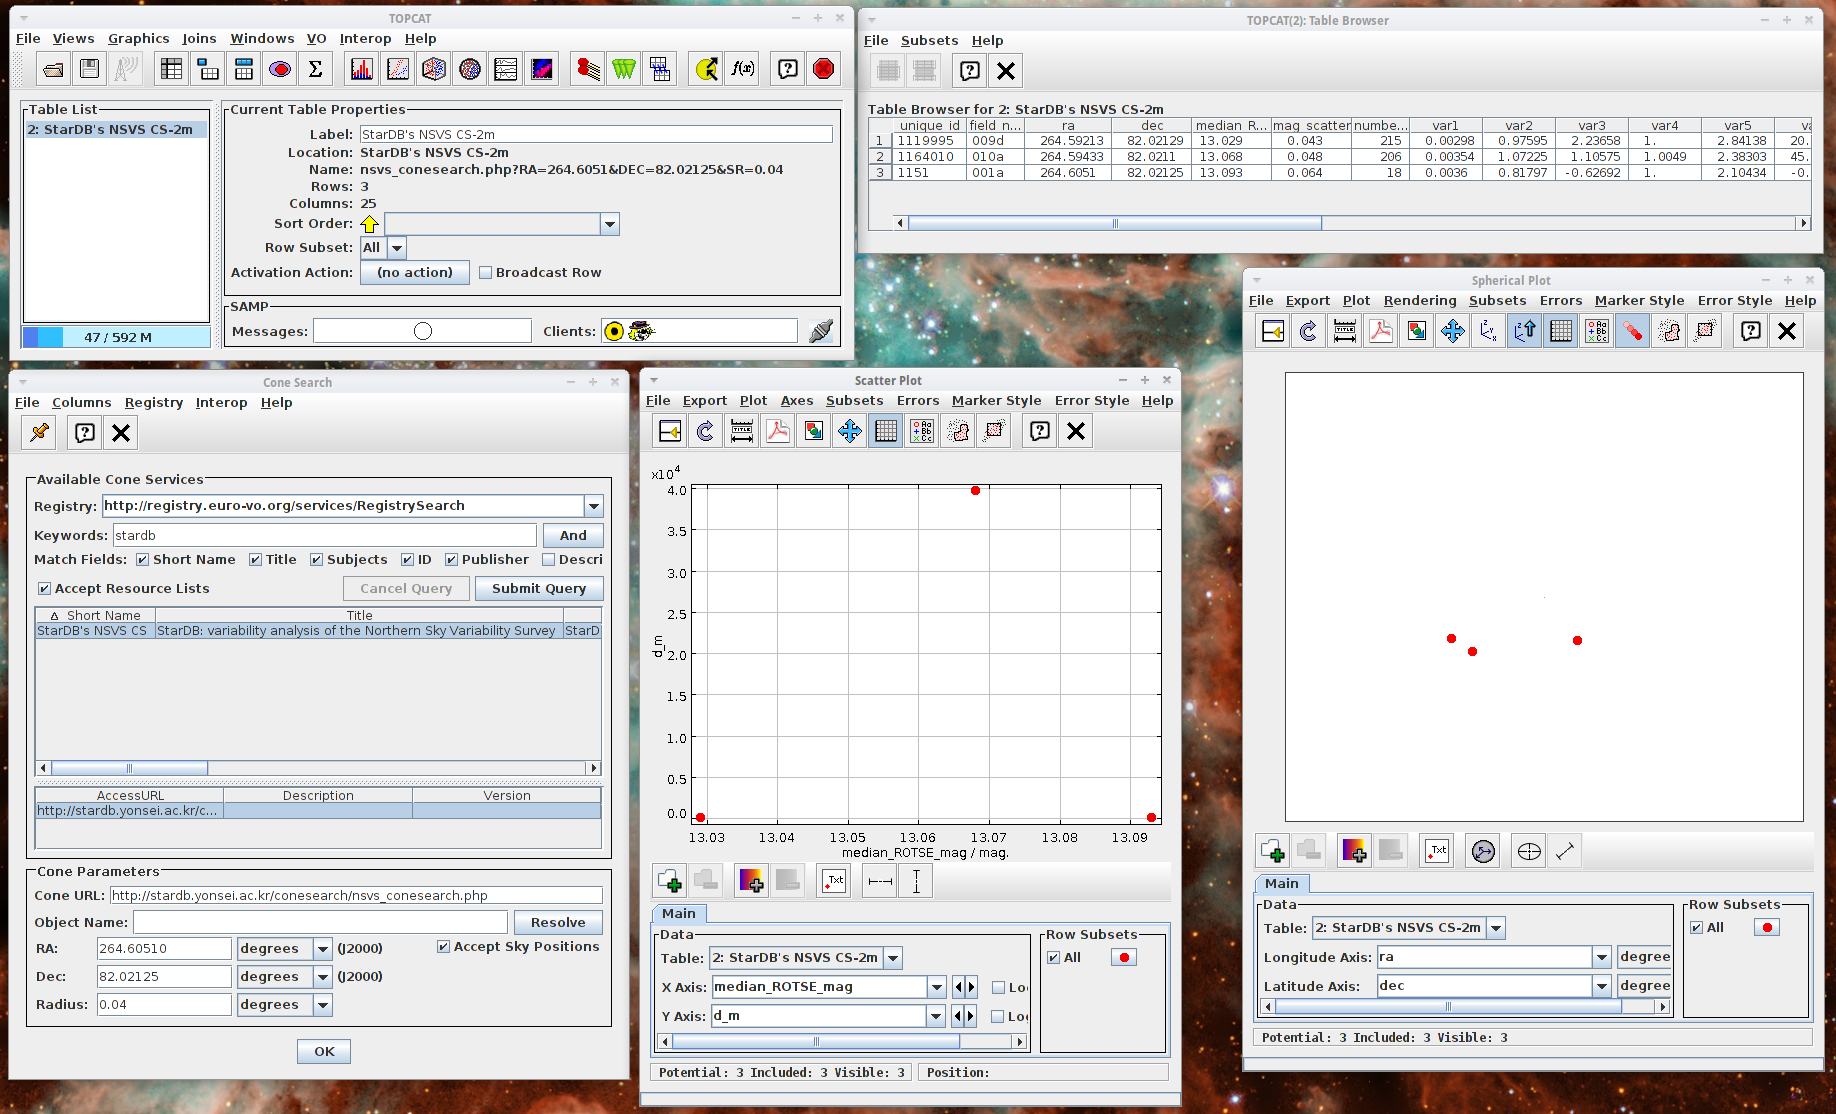
4. Finding variable candidates in the NSVS field by using Topcat.
You can also access the NSVS's simple cone search with RA/DEC and a search radius by using Topcat.
(Step 1) Run Topcat.
(Step 2) Open VO -> Cone Search window.
(Step 3) Choose Euro-VO as a registry. Search stardb as a keyword.
(Step 4) Select StarDB's NSVS CS, and then type RA/DEC as well as a search radius. When you click the OK button, the search result will be returned as a table which
can be used for plots.