|
|
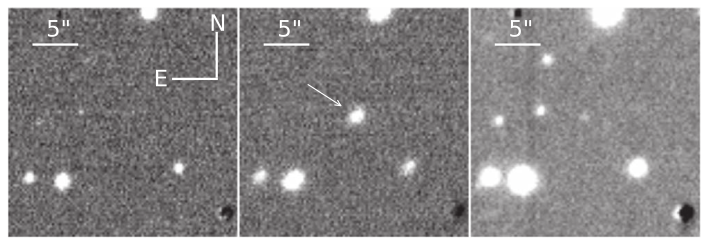
Figure 1. V-band images before the outburst (left), at the maximum luminosity (middle), and a 170 stacked V-band image in quiescence (right). The arrow points to KSP-OT-201611a. [From Figure 1 of Lee et al. 2019]
|
|
|
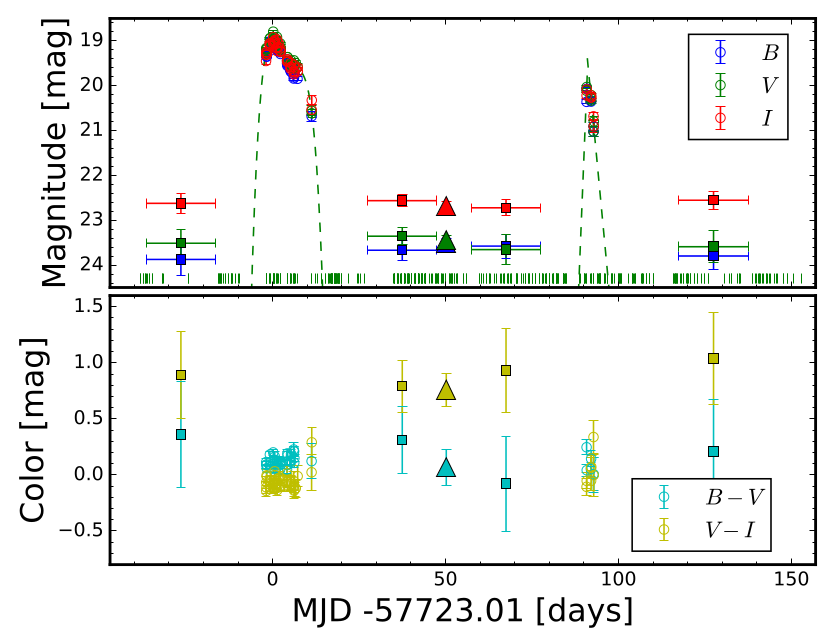
Figure 2. BVI light curves (top) and color evolutions (bottom) including the outburst and quiescent phases. Open circles represent outbursts. Quiescent data from 170 stacked images and 40–70 stacked images are depicted as filled triangles and squares, respectively. Horizontal bars on square symbols represent stacking ranges of 20 days. (Top) Blue, green, and red symbols indicate B, V, and I bands, respectively. Small vertical bars at the bottom of the panel represent the V-band epochs when the observations are made. Green dashed lines are V-band best-polynomial fits. (Bottom) Cyan and yellow symbols represent B-V and V-I colors, respectively. [From Figure 5 of Lee et al. 2019]
|
We present a multi-color, high-cadence photometric study of a distant dwarf nova KSP-OT-201611a discovered by the Korea Microlensing Telescope Network Supernova Program. From October 2016 to May 2017, two outbursts, which comprises a super/long outburst followed by a normal/short outburst separated by ~91 days, were detected in the BVI bands. The shapes and amplitudes of the outbursts reveal the nature of KSP-OT-201611a to be an SU UMa- or U Gem-type dwarf nova. Color variations of periodic humps in the super/long outbutst possibly indicate that KSP-OT-201611a is an SU UMa-type dwarf nova. The super and normal outbursts show distinctively different color evolutions during the outbursts due most likely to the difference of time when the cooling wave is formed in the accretion disk. The outburst peak magnitudes and the orbital period of the dwarf nova indicate that it is at a large Galactocentric distance (~13.8 kpc) and height (~1.7 kpc) from the Galactic plane. KSP-OT-201611a, therefore, may provide a rare opportunity to study the accretion disk process of Population II dwarf novae.
In the Data page, the light curve informations of KSP-OT-201611a are listed.
There is
a short news article in Korean.